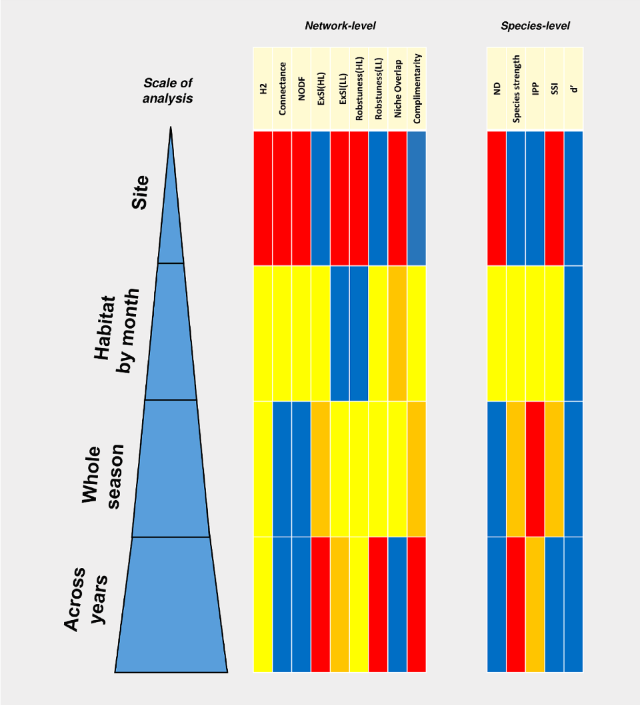
It’s long been recognised that the scale at which we study the natural world – over long or short time periods, or across small areas or whole regions – affects the conclusions that we draw about ecological patterns and processes. This is certainly true of plant-pollinator interactions. For example, a widely distributed plant can have very different pollinators at the extremes of its range, and pollinators like bees may vary their focus on nectar and pollen sources from year to year.
The analysis of these interactions as networks of actors has become increasingly popular in the last couple of decades. However there is no consensus about how frequent sampling should be, or the geographical scale over which networks should be studied. In fact all scales (from regional “meta-networks” down to single-season, single-site, single taxon observations) are relevant, depending on the questions being asked or the hypotheses posed.
But it’s important that we acknowledge that conclusions drawn at one scale may not apply at other scales.
That’s the take home message from a paper published this week which is the latest output from the PhD work of Australian bee expert Kit Prendergast. We have collaborated on several papers based on her data and this is actually my 100th peer-reviewed publication: a proud milestone for me and one which I’m glad to share with a wonderful early career researcher like Kit!
Here’s the reference with a link to a read-only version of the paper:
Bipartite networks of flowering plants and their visitors (potential pollinators) are increasingly being used in studies of the structure and function of these ecological interactions. Whilst they hold much promise in understanding the ecology of plant– pollinator networks and how this may be altered by environmental perturbations, like land-use change and invasive species, there is no consensus about the scale at which such networks should be constructed and analysed. Ecologists, however, have emphasised that many processes are scale dependent. Here, we compare network- and species-level properties of ecological networks analysed at the level of a site, pooling across sites within a given habitat for each month of surveys, and pooling across all sites and months to create a single network per habitat type. We additionally considered how these three scales of resolution influenced conclusions regarding differences between networks according to two contrasting habitat types (urban bushland remnants and residential gardens) and the influence of honey bee abundance on network properties. We found that most network properties varied markedly depending on the scale of analysis, as did the significance, or lack thereof, of habitat type and honey bee abundance on network properties. We caution against pooling across sites and months as this can create unrealistic links, invalidating conclusions on network structure. In conclusion, consideration of scale of analysis is also important when conducting and interpreting plant–pollinator networks.
Within the last decade there’s been a growing awareness of the importance of urban environments for supporting populations of pollinators, especially bees. Indeed, I devoted a whole chapter of my book Pollinators & Pollination: Nature and Society to the topic, though even then I was only able to scratch the surface of the research that’s been done. Since then there’s been some important studies published and this 2020 review by Kath Baldock provides a good starting point for the topic, whilst a recent pre-print by Pietro Maruyama and colleagues emphasises how little we know about pollinators in tropical cities.
One of the most detailed studies of urban solitary bees in a British town was conducted by Muzafar Sirohi when he was a PhD researcher in my department in Northampton. The first paper from that work, documenting the diversity and abundance of bees, came out in 2015, but since then commitments to other projects, plus Muzafar’s return to his university in Pakistan, have meant that we’ve struggled to find the time to publish more. Hopefully that’s changing and the second publication from Muzafar’s thesis is now out, with a third in progress.
This new paper uses a network approach to study the use of flowers by these bees; here’s the reference with a link to a read-only copy of the paper, followed by the abstract.
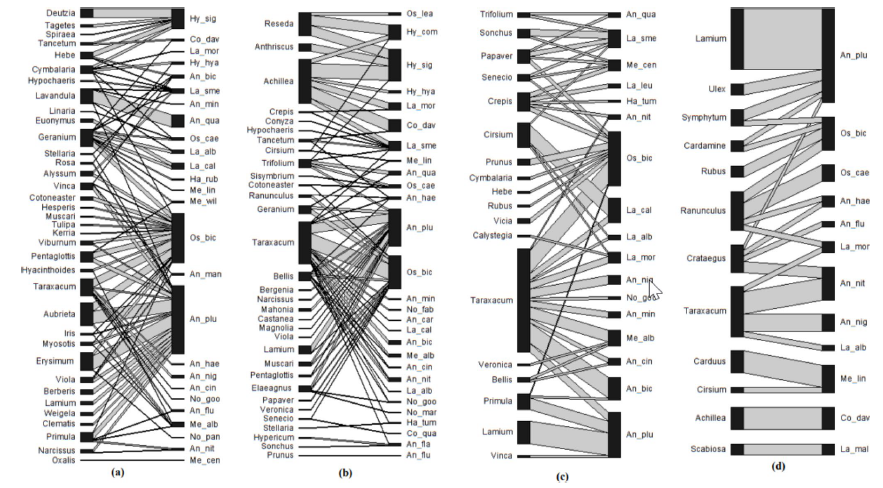
Biodiversity is declining through human activities and urbanisation is often seen as a particular concern. Urban settings, however, provide diverse microclimatic conditions for plants and pollinating insects, and therefore may be significant habitats for the conservation of solitary and primitively eusocial bees, a major group of pollinators. This study analysed the interactions between these bees and the plants on which they forage, using a network approach. We compared urban habitats (gardens, roadsides, and open vegetation) in a large British town with nearby nature reserves. One native plant Taraxacum officinale (dandelion) was a core generalist species visited in all habitat types. Other core plant species restricted to particular habitats include species of Geranium, Bellis, Crepis, and Ranunculus. Two generalist bee species, Anthophora plumipes and Osmia bicornis were the core visitor species within the networks. The networks were comparatively more nested in urban habitat types than nature areas, suggesting more frequent interactions between generalist and specialist species in urban areas. Network connectance, network level specialisation (H2’ index), and plant generality (network level) were not significantly different in urban and nature areas. However, visitor generality was found to be significantly higher in urban gardens than in nature areas. Careful management of common urban vegetation would be beneficial for supporting urban wild pollinators.
One of the projects with which I’ve been involved over the past few years has been a collaboration with researchers at Imperial College and the Natural History Museum, alongside regional collections in the UK, to assess how museum specimens of bumblebees (Bombus spp.) can be used to look at long-term ecological changes in pollinator populations. The first two papers from that project were published in August but because of my trip to Kenya I’ve only now been able to post about them.
The details of the papers (both of which are open access and free to download) are below, followed by the official press release:
Arce, A., Cantwell-Jones, A., Tansley, M., Barnes, I., Brace, S., Mullin, V., Notton, D., Ollerton, J., Eatough, E., Rhodes, M., Bian, X., Hogan, J., Hunter, T., Jackson, S., Whiffin, A., Blagoderov, V., Broad, G., Judd, S., Kokkini, P., Livermore, L., Dixit, M., Pearse, W. & Gill, R. (2022) Signatures of increasing environmental stress in bumblebee wings over the past century: Insights from museum specimens. Journal of Animal Ecology 00, 1– 13. https://doi.org/10.1111/1365-2656.13788
Mullin, V. E., Stephen, W., Arce, A. N., Nash, W., Raine, C., Notton, D. G., Whiffin, A., Blagderov, V., Gharbi, K., Hogan, J., Hunter, T., Irish, N., Jackson, S., Judd, S., Watkins, C., Haerty, W., Ollerton, J., Brace, S., Gill, R. J., & Barnes, I. (2022). First large-scale quantification study of DNA preservation in insects from natural history collections using genome-wide sequencing. Methods in Ecology and Evolution, 00, 1– 12. https://doi.org/10.1111/2041-210X.13945
OFFICIAL PRESS RELEASE: Museum collections indicate bees increasingly stressed by changes in climate over the past 100 years
• An analysis of bumblebee wings from a network of UK museums shows signs of stress linked to increasingly hotter and wetter conditions. • As well as revealing what is linked to stress in bees in the past, the study can help predict when and where bees will face most stress and potential decline in the future. • Bumblebees and other insect pollinators have faced population declines in recent years. • The researchers have also for the first time used ancient DNA techniques to sequence bumblebee genomes dating back over 100 years. Scientists from Imperial College London and the Natural History Museum today published two concurrent papers analysing UK bumblebee populations.
The first investigated the morphology (body shapes) of bee specimens dating back to 1900. Using digital images, the group first investigated the asymmetry in bumblebee wings as an indicator of stress. High asymmetry (very differently shaped right and left wings) indicates the bees experienced stress during development – an external factor that affected their normal growth.
Studying four UK bumblebee species, the group found evidence for stress getting higher as the century progressed from its lowest point around 1925. Further analysis showed that each bee species displayed a consistently higher proxy of stress in the latter half of the century.
Learning from the past to predict the future By taking the climate conditions during the year of collection – namely annual mean temperature and annual rainfall – the team found that in hotter and wetter years bees showed higher wing asymmetry. The study is published today in the Journal of Animal Ecology.
Author Aoife Cantwell-Jones, from the Department of Life Sciences (Silwood Park) at Imperial, said: “By using a proxy of stress visible on the bee’s external anatomy and caused by stress during development just days or weeks before, we can look to more accurately track factors placing populations under pressure through historic space and time.”
Author Dr Andres Arce, now at the University of Suffolk, stated: “Our goal is to better understand responses to specific environmental factors and learn from the past to predict the future. We hope to be able to forecast where and when bumblebees will be most at risk and target effective conservation action.”
Senior author Dr Richard Gill, from the Department of Life Sciences (Silwood Park) at Imperial, said: “With hotter and wetter conditions predicted to place bumblebees under higher stress, the fact these conditions will become more frequent under climate change means bumblebees may be in for a rough time over the 21st century.”
DNA from a single leg As well as measuring the wing shapes of bees, in a second parallel study the team successfully sequenced the genomes of over a hundred bumblebee museum specimens dating back more than 130 years. In a pioneering advance, ancient DNA methods typically used for studying woolly mammoths and ancient humans, were for the first time used on an insect population.
Scientists from the Natural History Museum and the Earlham Institute quantified DNA preservation using just a single bee leg from each of the bees studied to create a baseline genome for each of the four species.
From these developments, published today in Methods in Ecology & Evolution, the researchers can now look to determine how the reported stress may lead to genetic diversity loss.
In conjunction with providing a new reference genome, the team will now use this data to study how bee genomes have changed over time, gaining an understanding of how whole populations have adapted – or not – to changing environments.
The value of museum collections Focusing on bumblebee collections, the team worked with curators from the Natural History Museum London, National Museums Scotland, Oxford University Museum of Natural History, World Museum Liverpool, and Tullie House Museum Carlisle.
Author Dr Victoria Mullin, from the Natural History Museum, said: “Museum insect collections offer an unparalleled opportunity to directly study how the genomes of populations and species have been affected by environmental changes through time. However, they are a finite resource and understanding how best to utilise them for genetic studies is important.”
Senior author Professor Ian Barnes, from the Natural History Museum, said: “One of the main problems with museum collections is that the quality of DNA can be very variable, making it difficult to predict which type of analyses we should do. We now have a much better idea about DNA preservation in insect collections, which is a massive boost to our ongoing work to understand the history and future of insect populations.”
Dr Gill concluded: “These studies showcase the value of leveraging museums specimens to go back in time and unlock the past’s secrets. But what we have done is just the beginning, and by continuing our work with these vital public collections and collaborating with curators we can only discover more. All this work was part of a Natural Environment Research Council-funded project and could not have been achieved without the commitment, hard work, and diligence of the museum curators, and our other collaborators”.
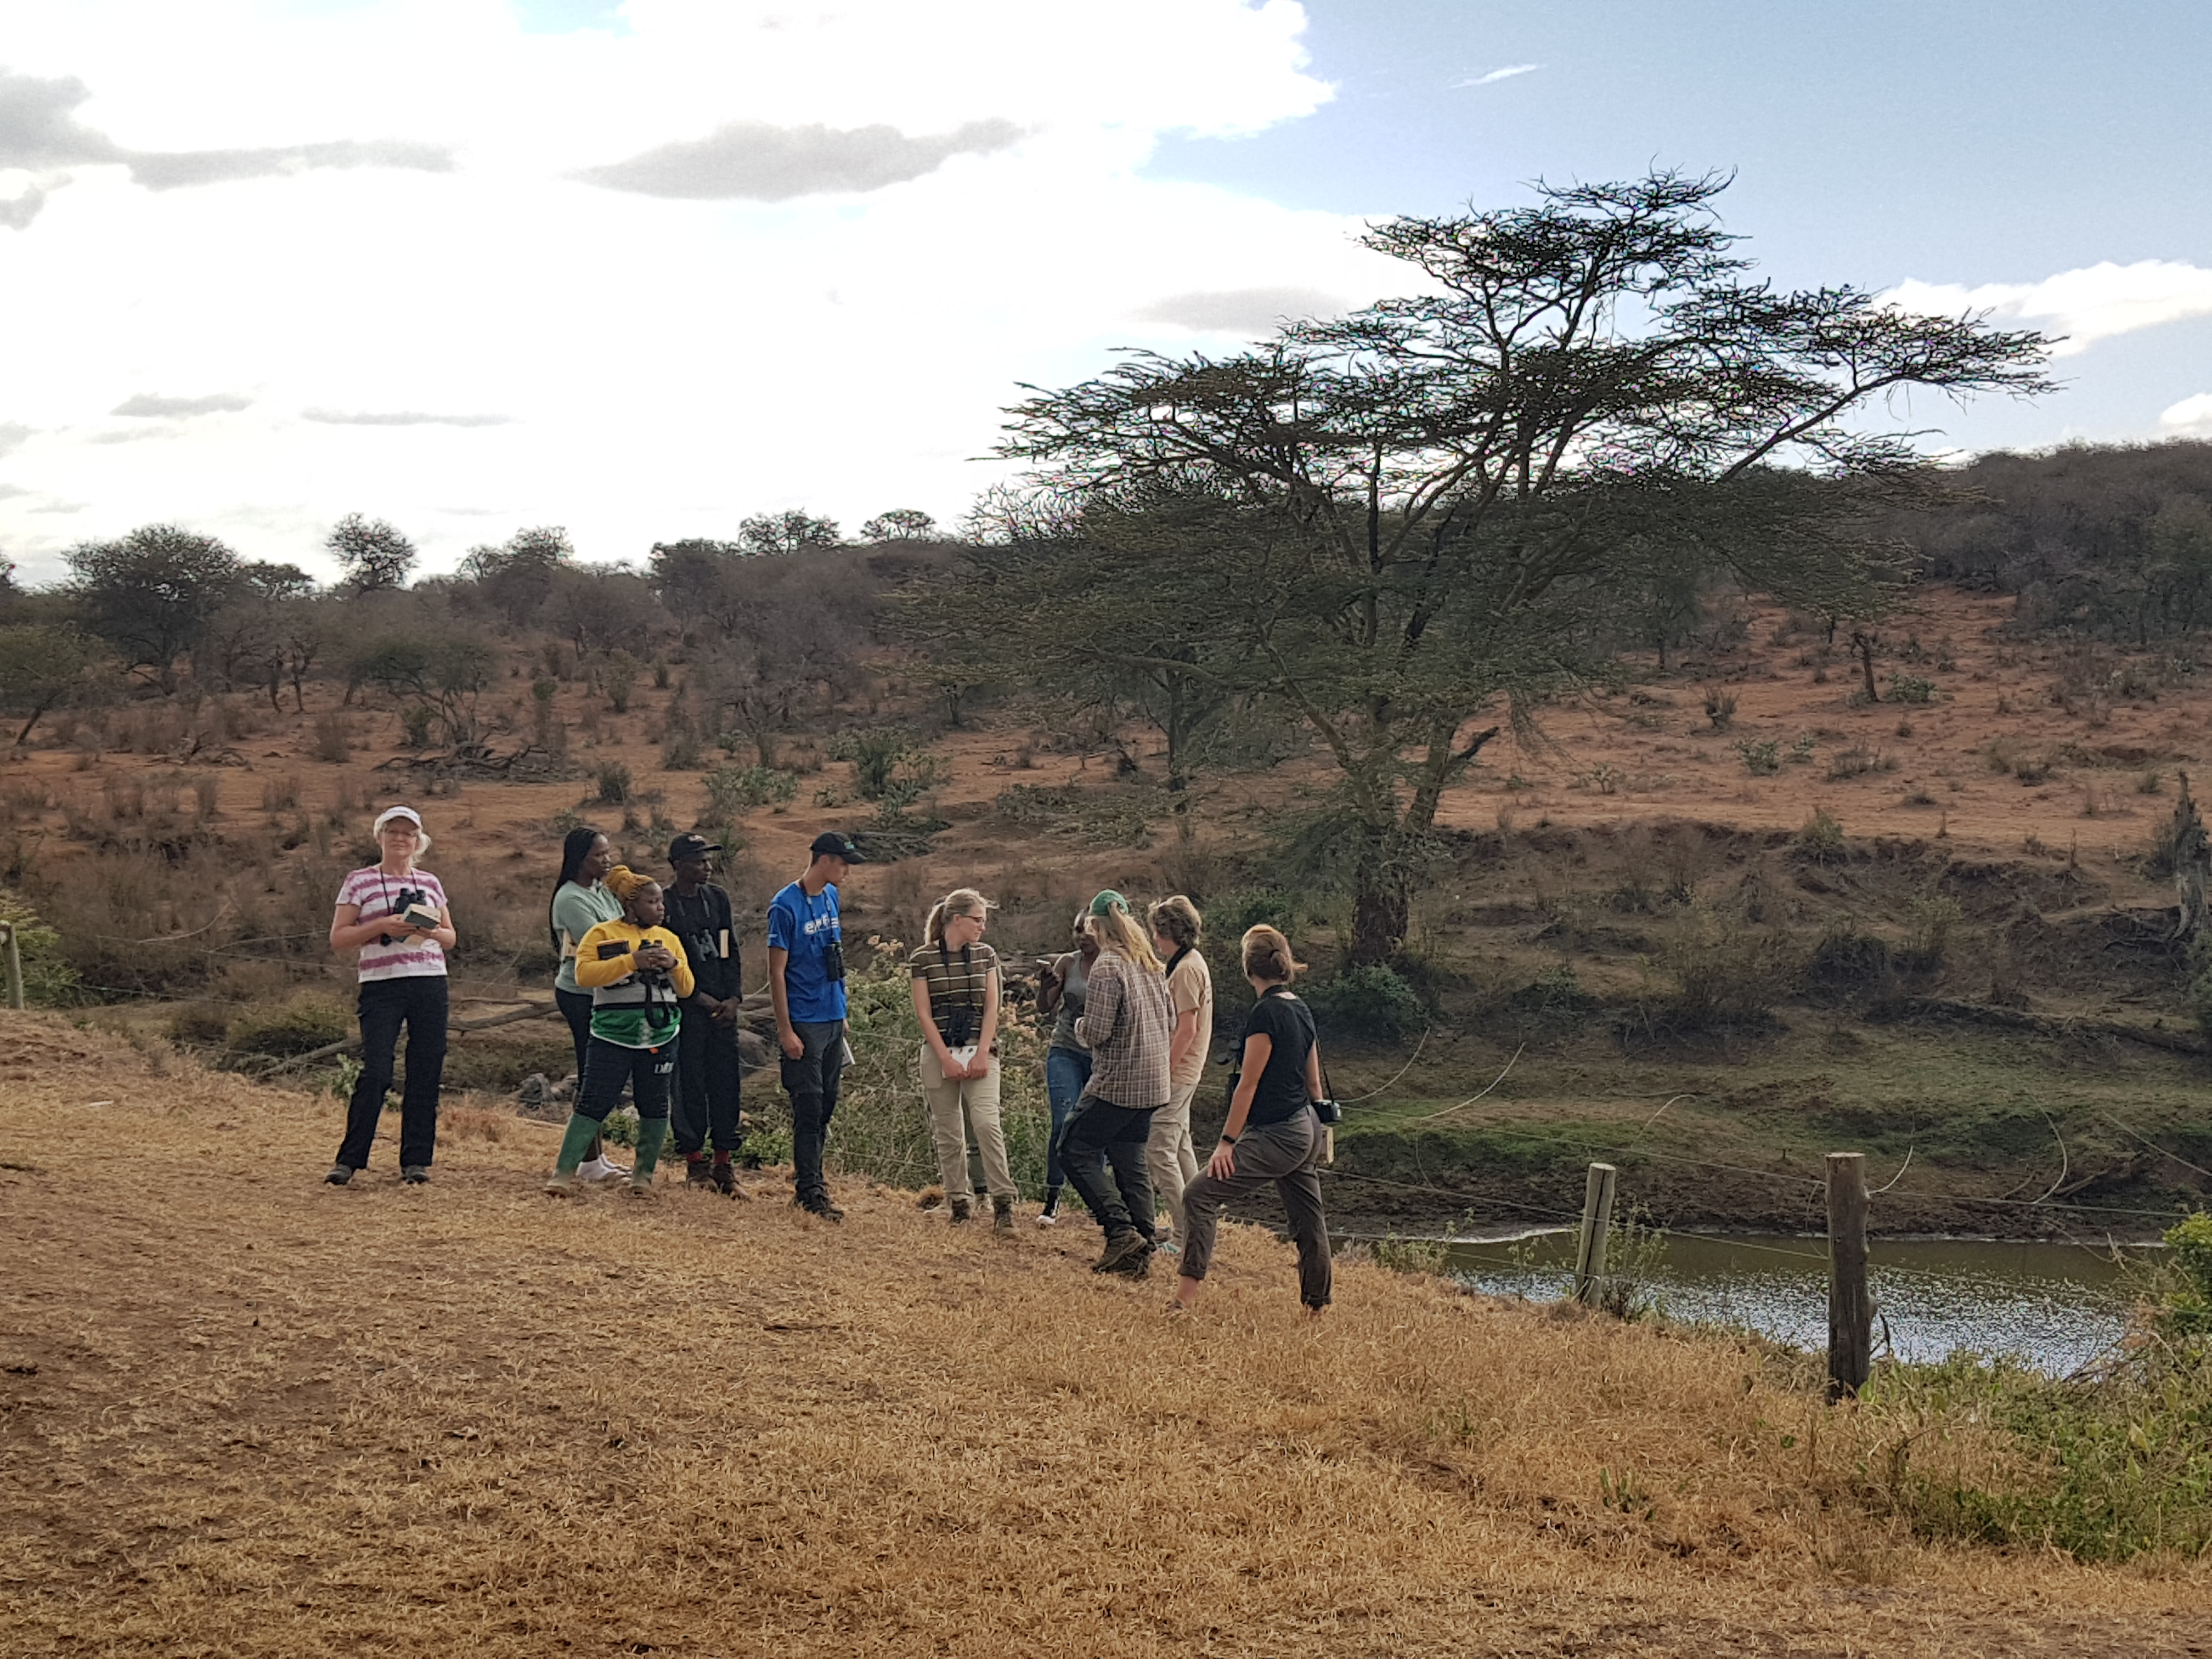
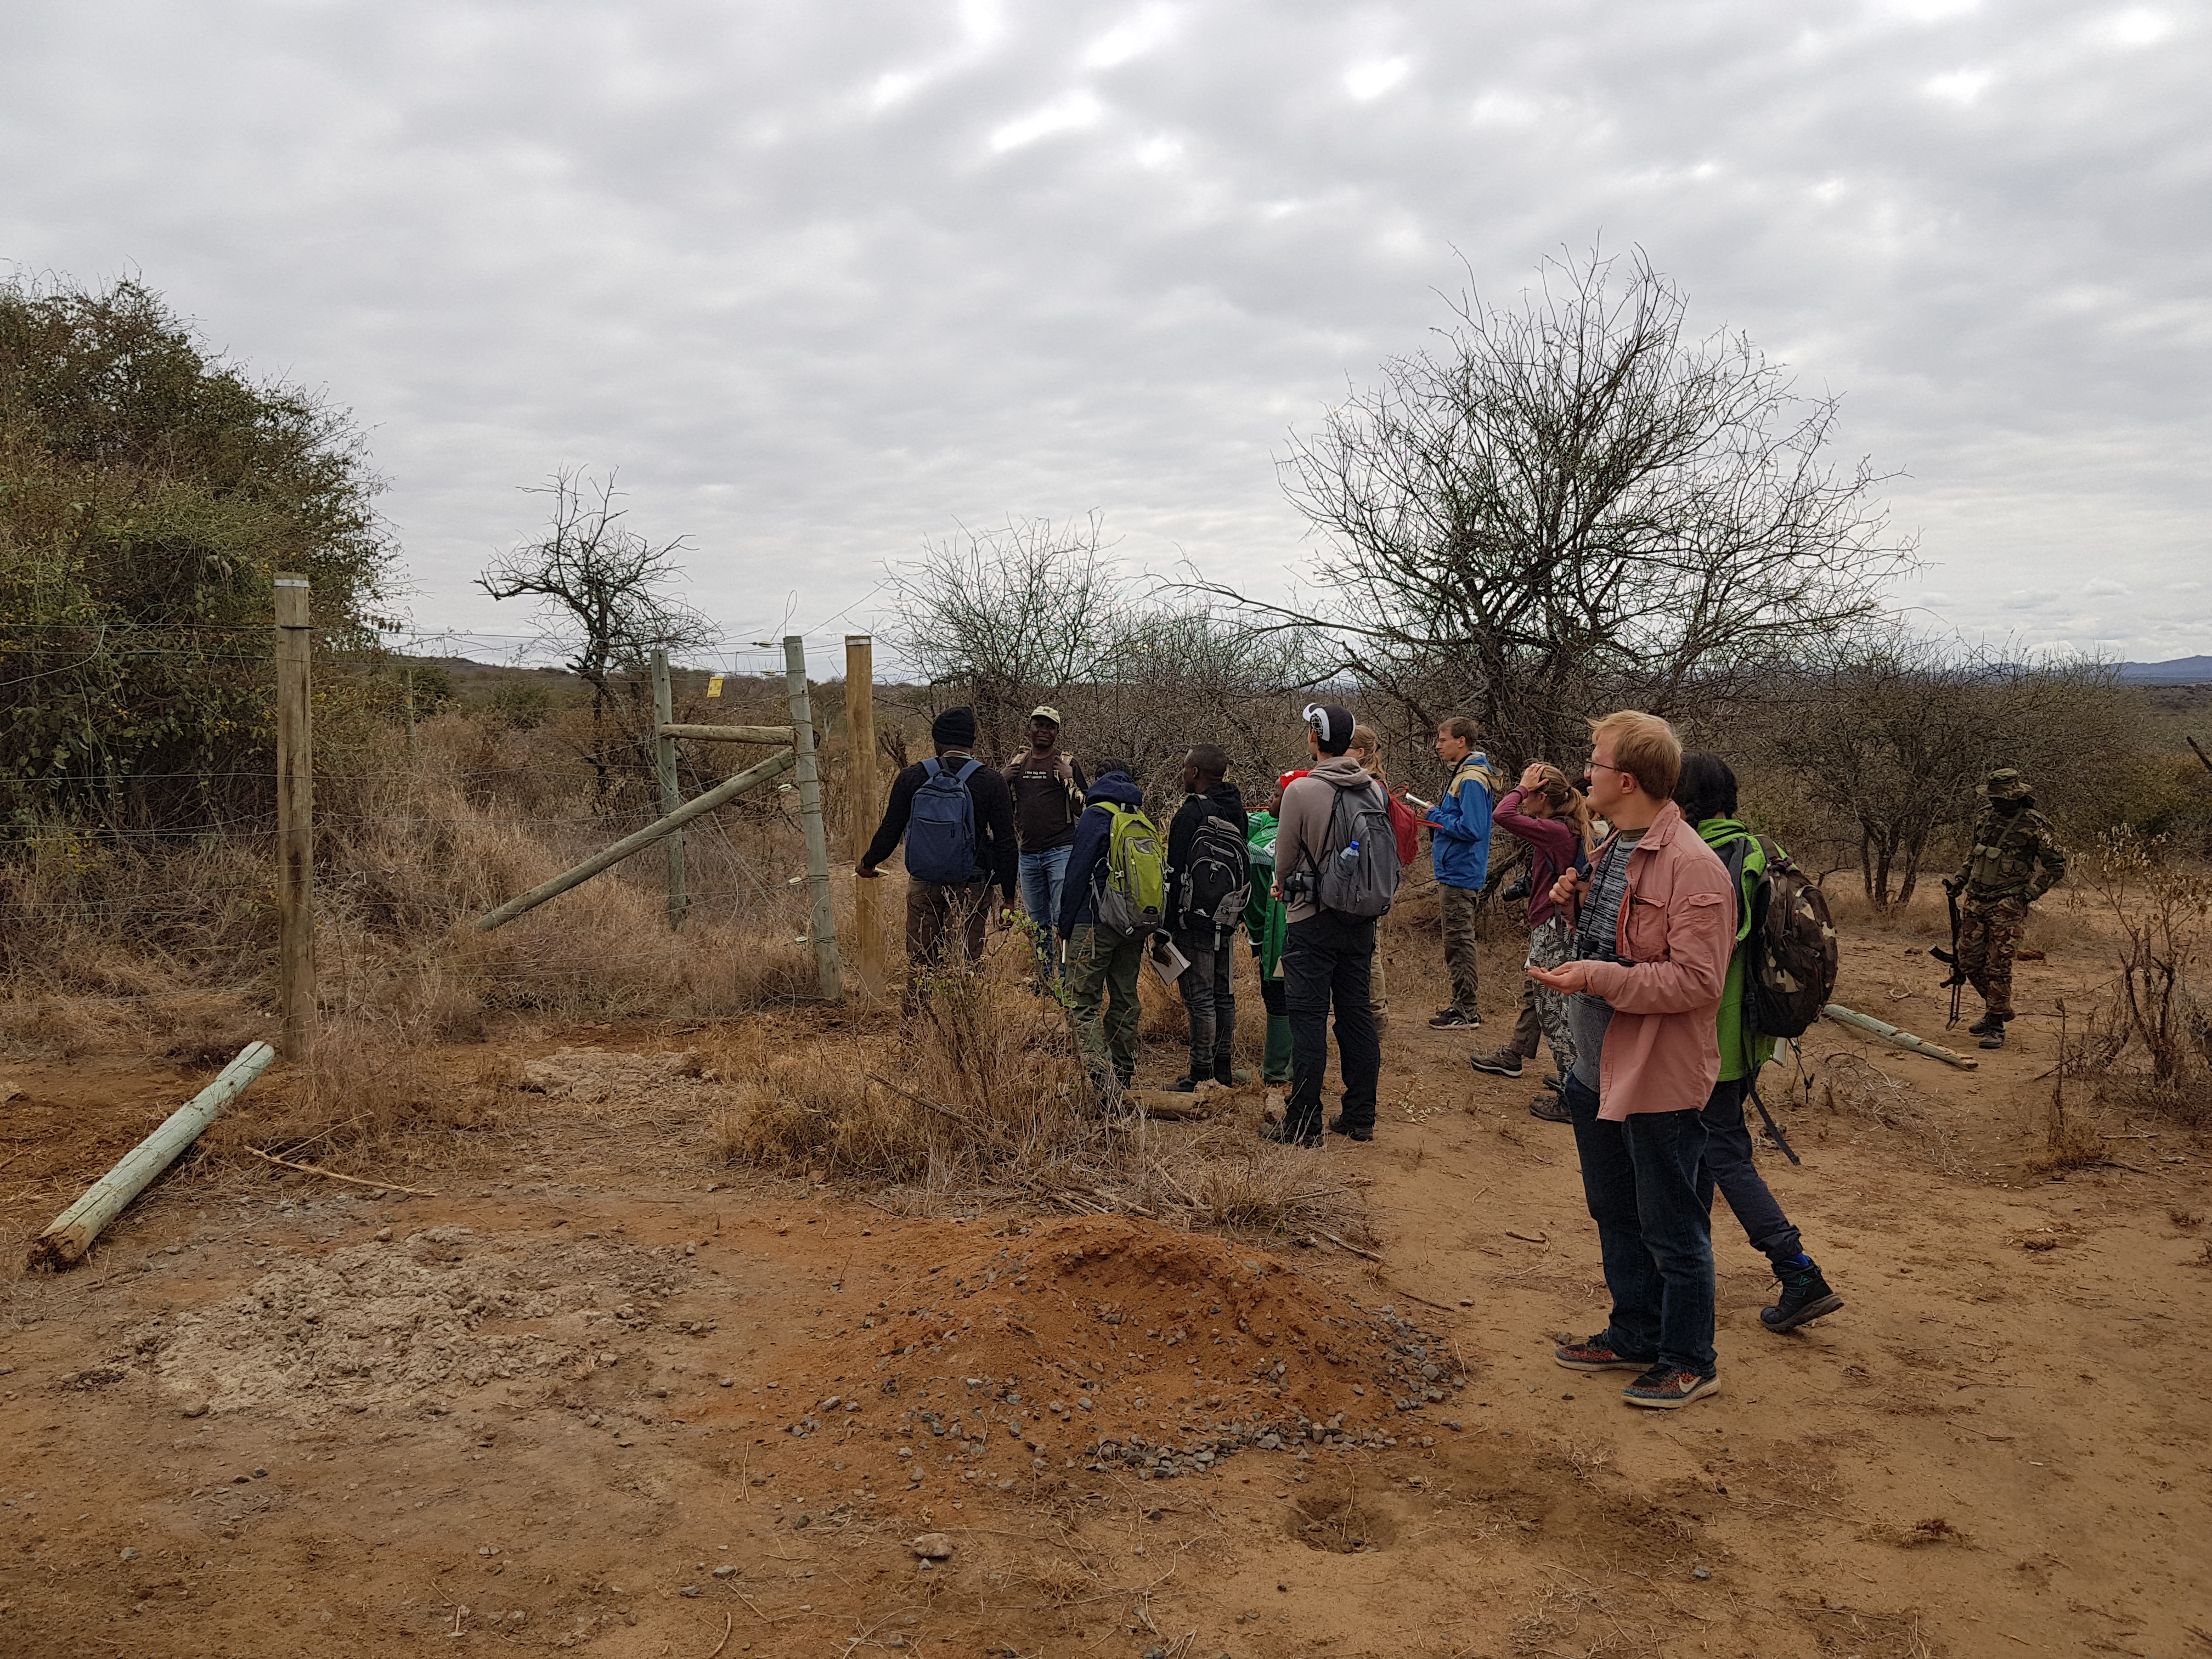
The blog has been quiet over August because Karin and I have been in Kenya for most of the month at the Mpala Research Centre. I’m here teaching on a Tropical Biology Association (TBA) field course, as well as doing some writing. In addition to sharing the adventure, Karin is also writing and acting as unofficial field course therapist!
This is the second TBA field course on which I have taught, the other being in Tanzania back in 2011, and it’s a pleasure to give some time to this remarkable organisation. The model is a very simple one: take 24 students, half from Africa and half from Europe, and embed them in a field work environment for a month, where they learn from one another and from their tutors about ecology and conservation. It’s been hugely successful and TBA alumni now hold senior positions in national conservation departments and NGOs, and universities, across Africa and Europe. Some of the African alumni are also returning to help teach on the field course.
We’re back in Denmark around the 9th September but in the meantime here’s a selection of photographs showing where we are staying and the work that we are doing.
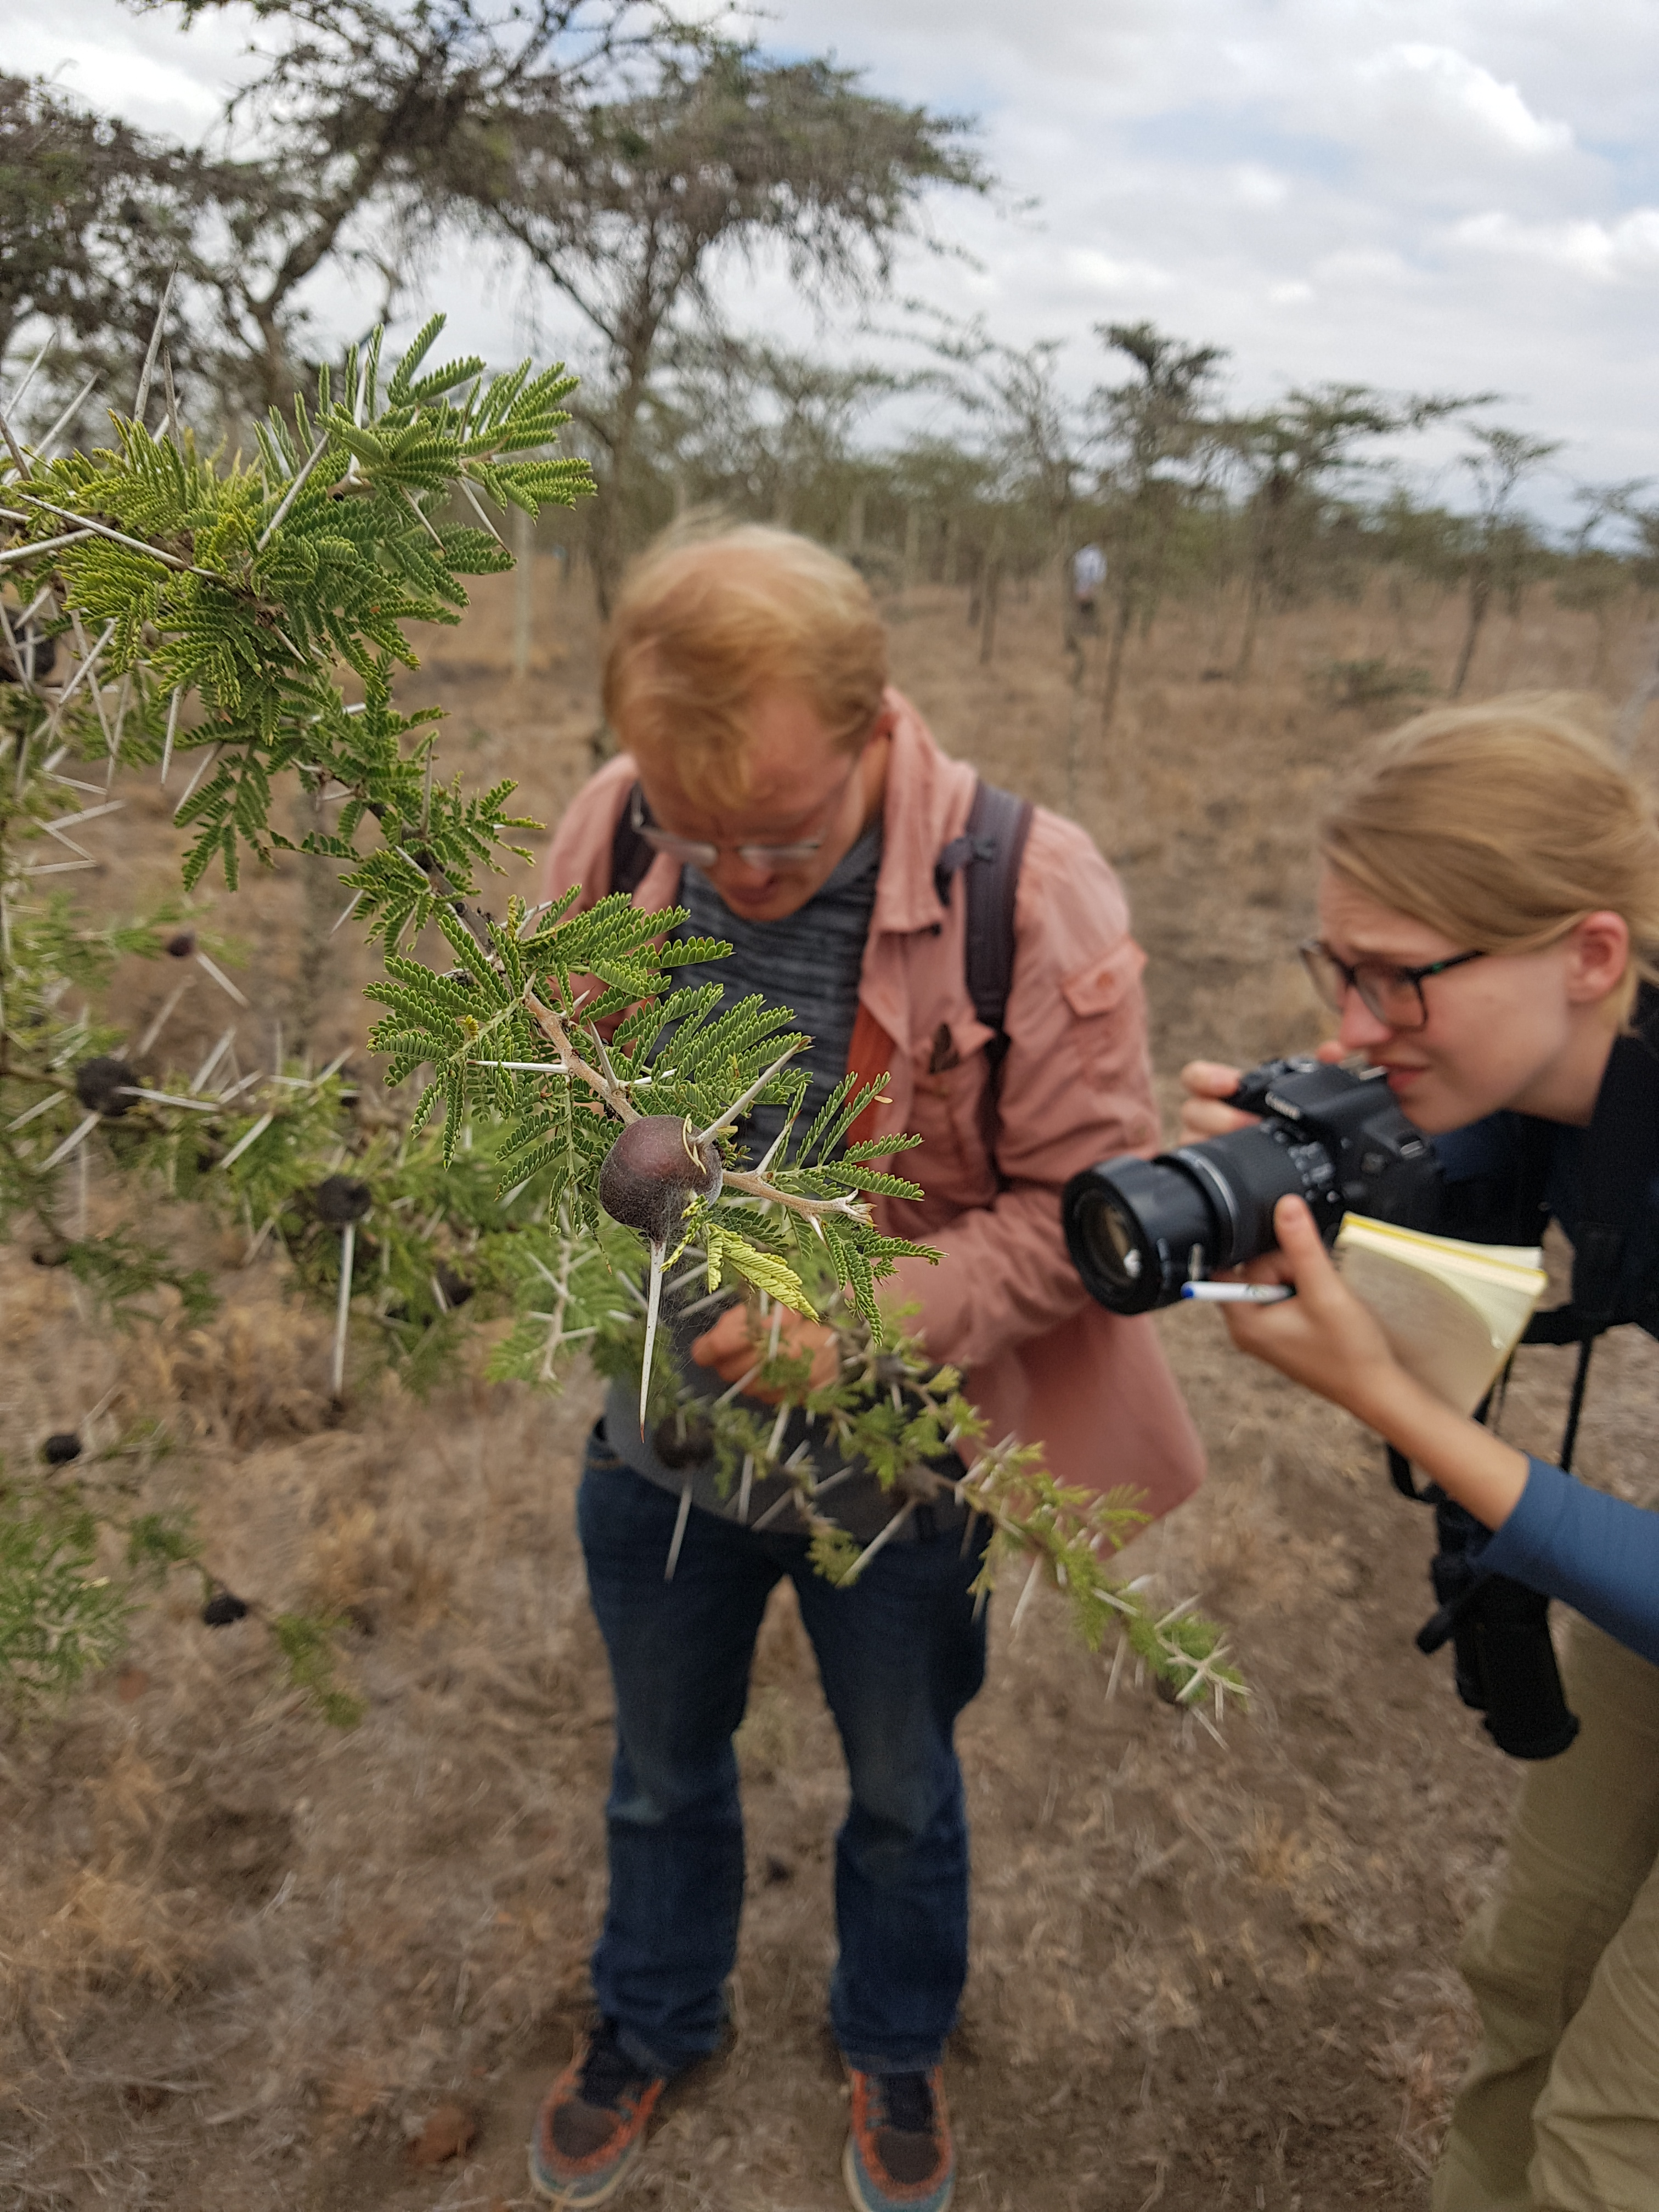
Getting up close with an Acacia species that defends itself by housing colonies of ants in its inflated thorns.
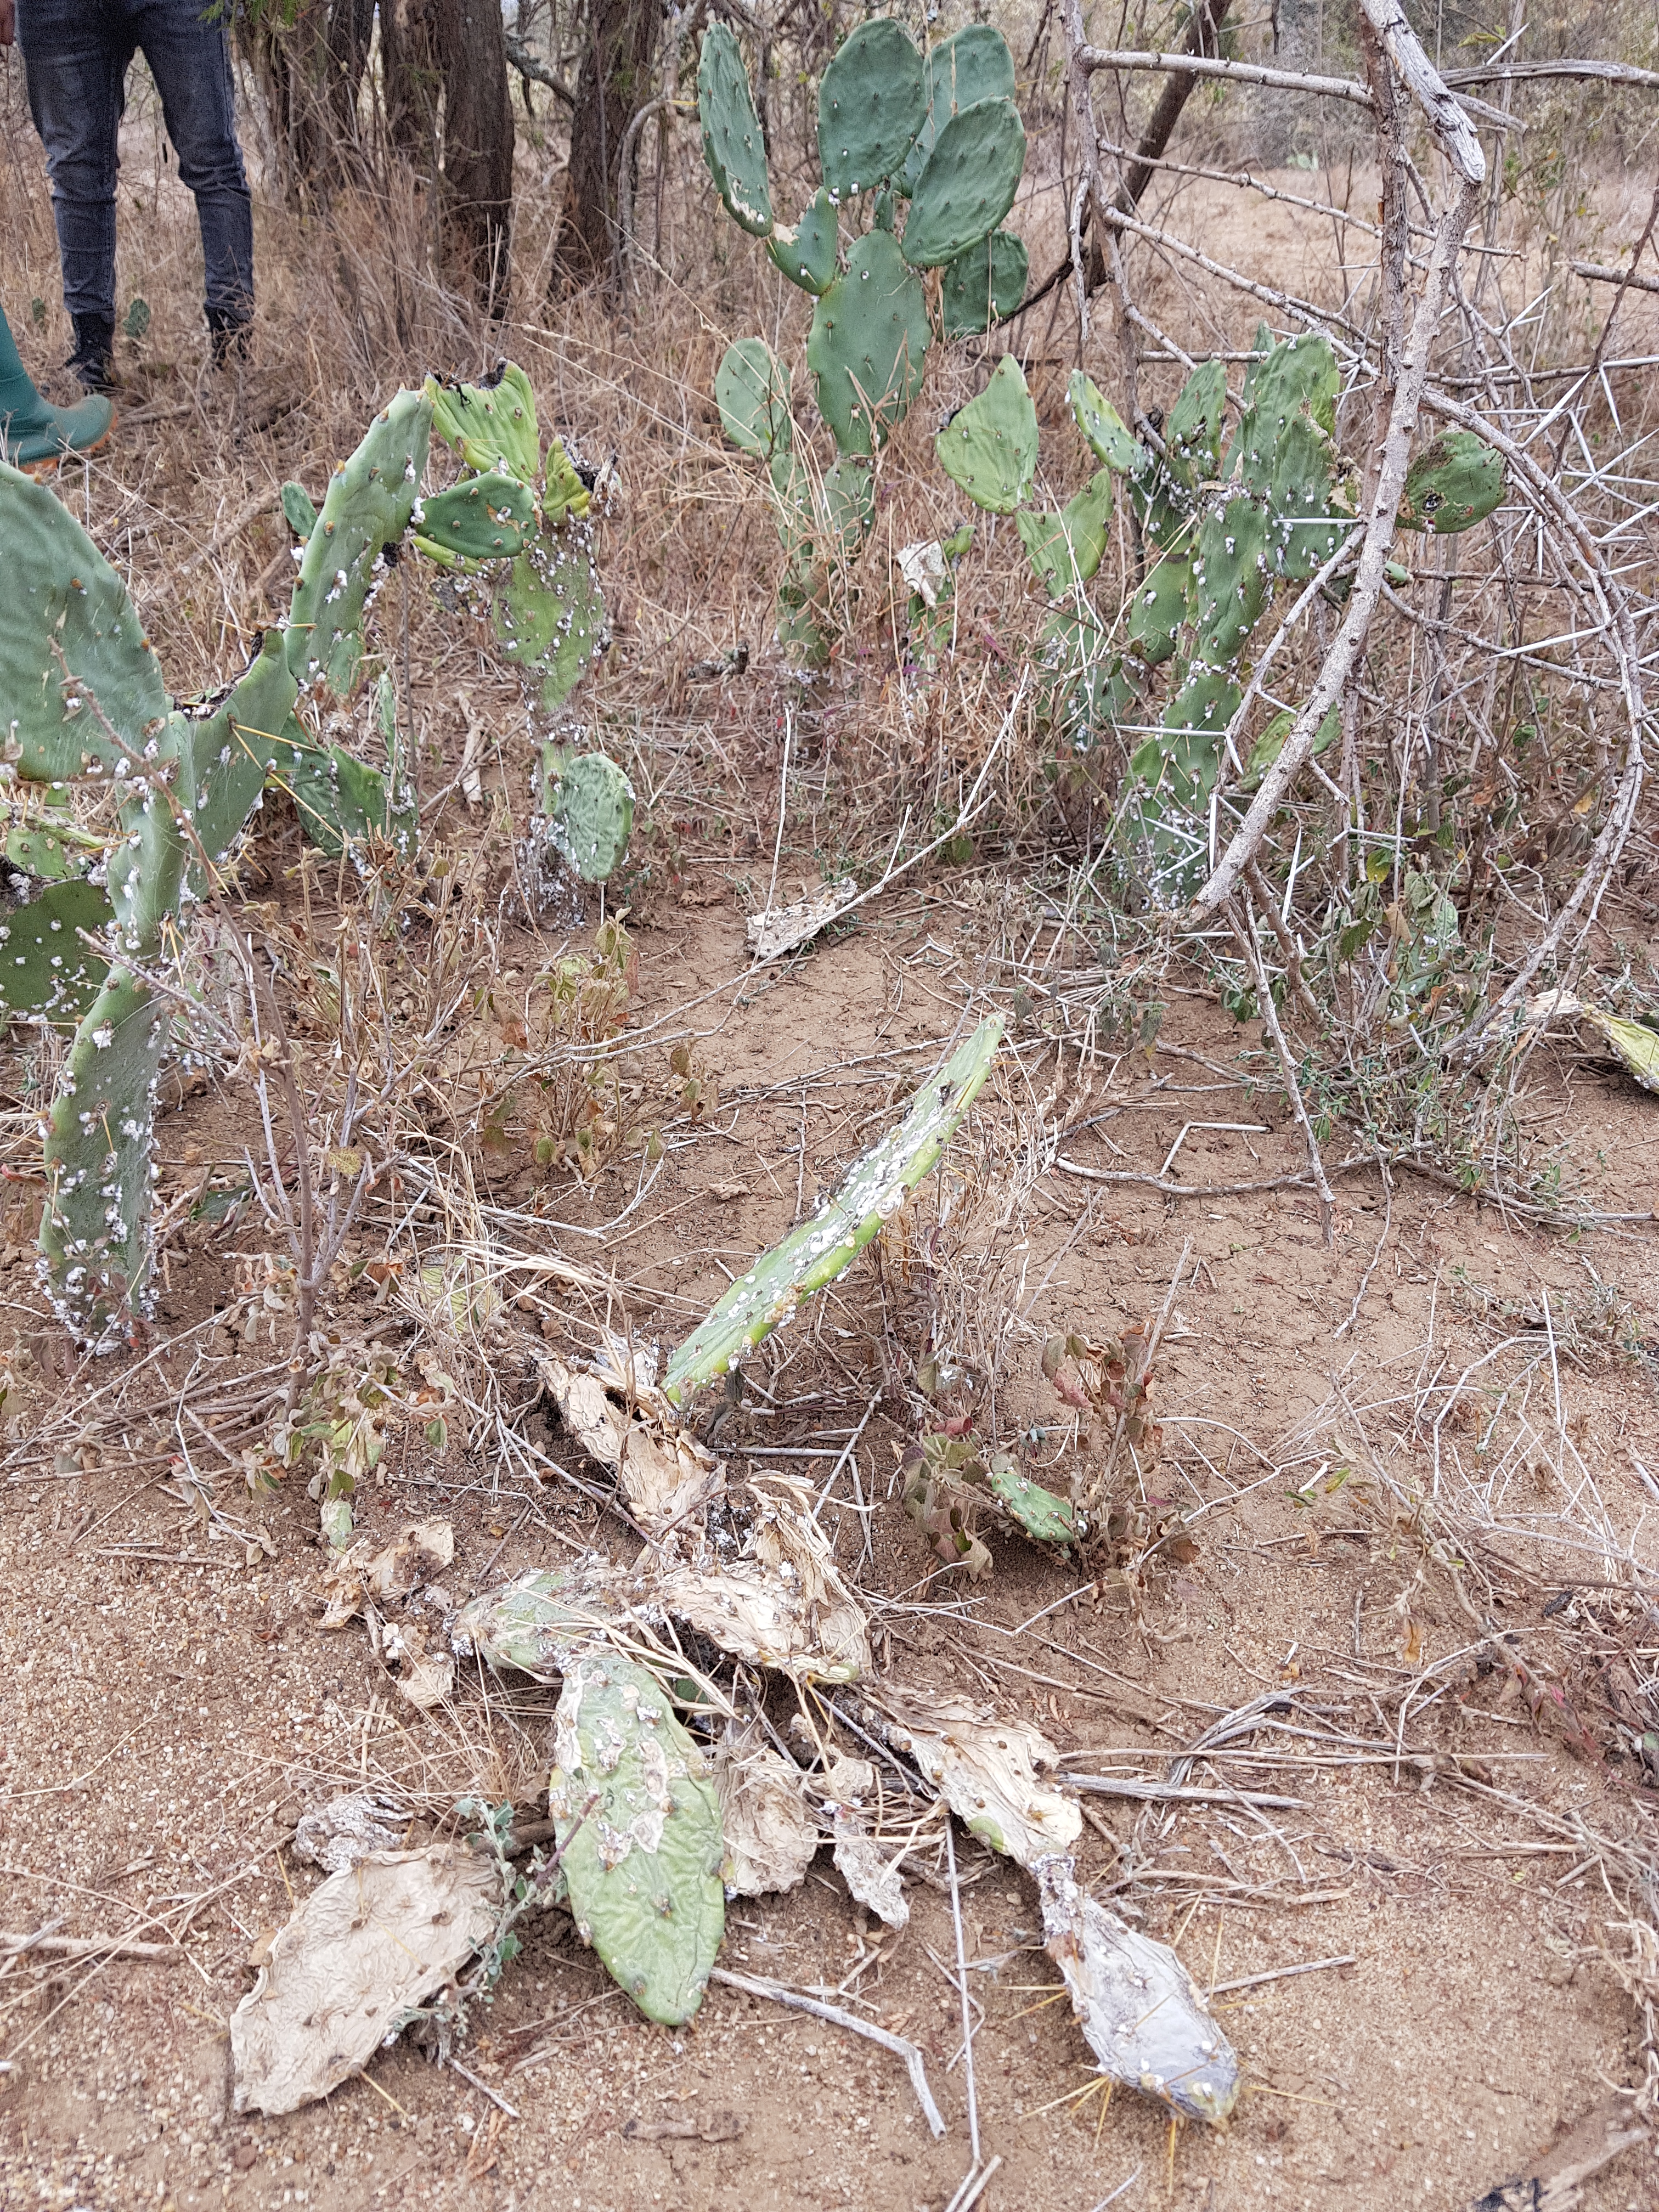
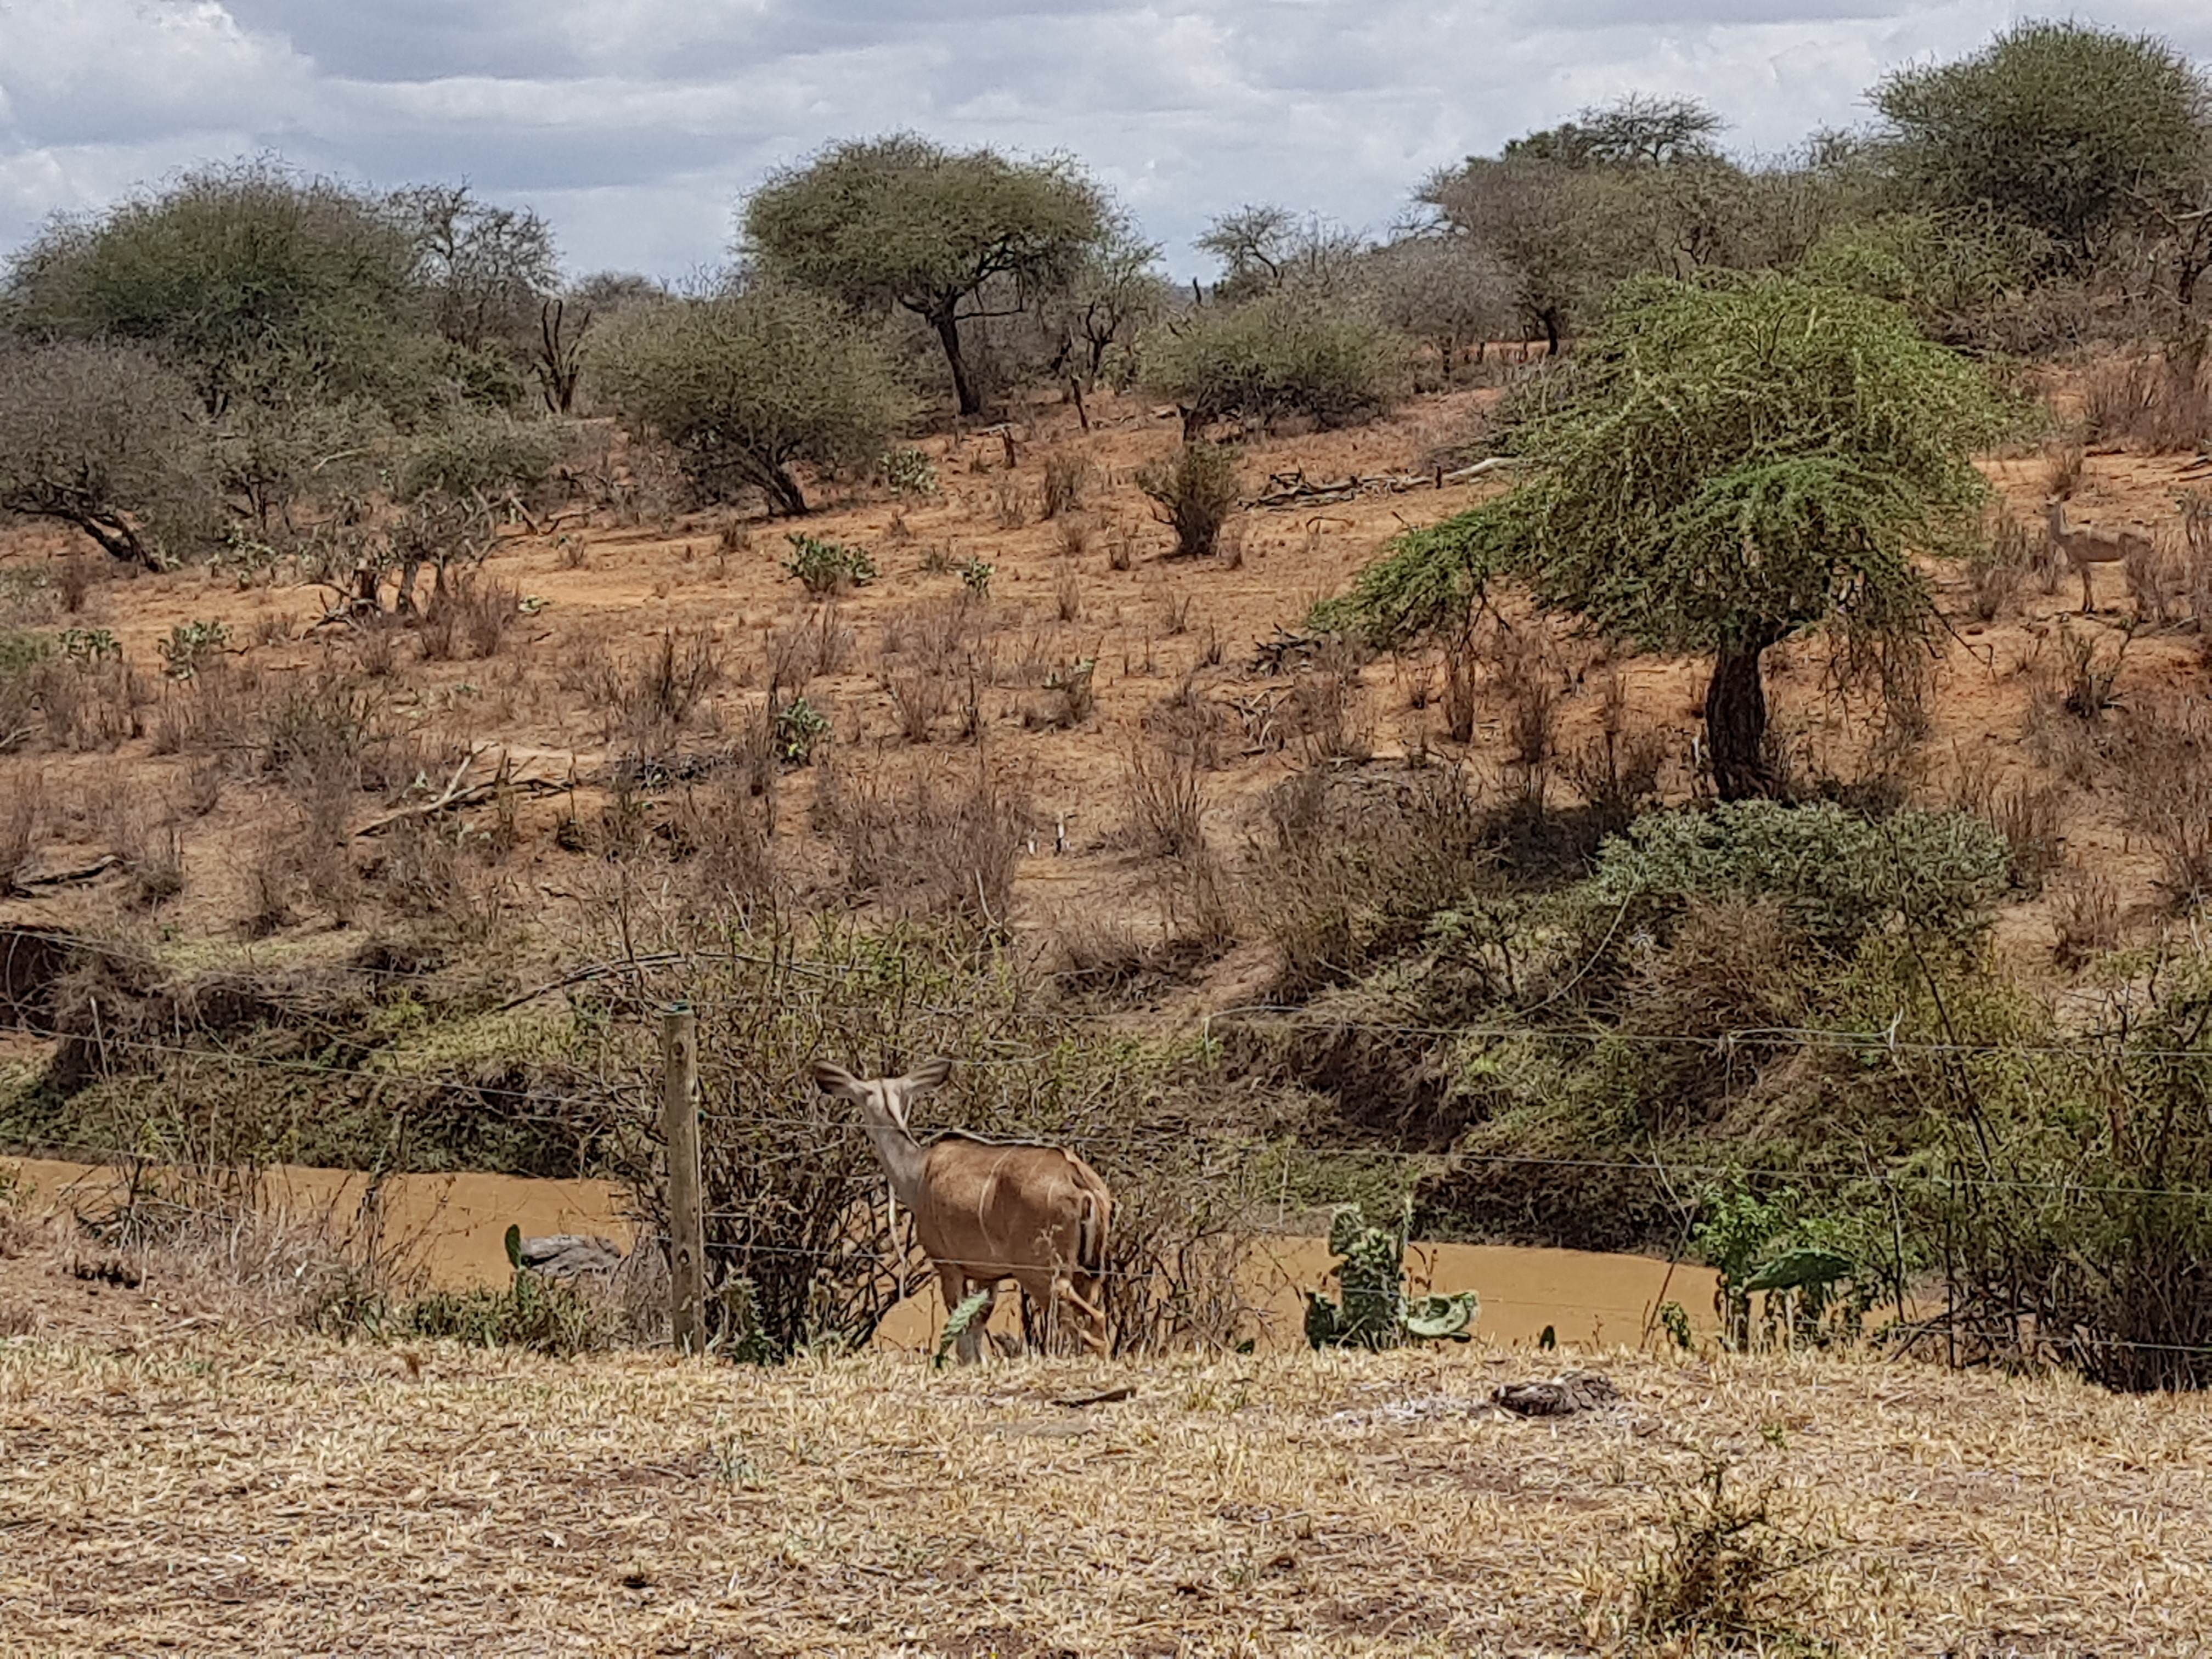
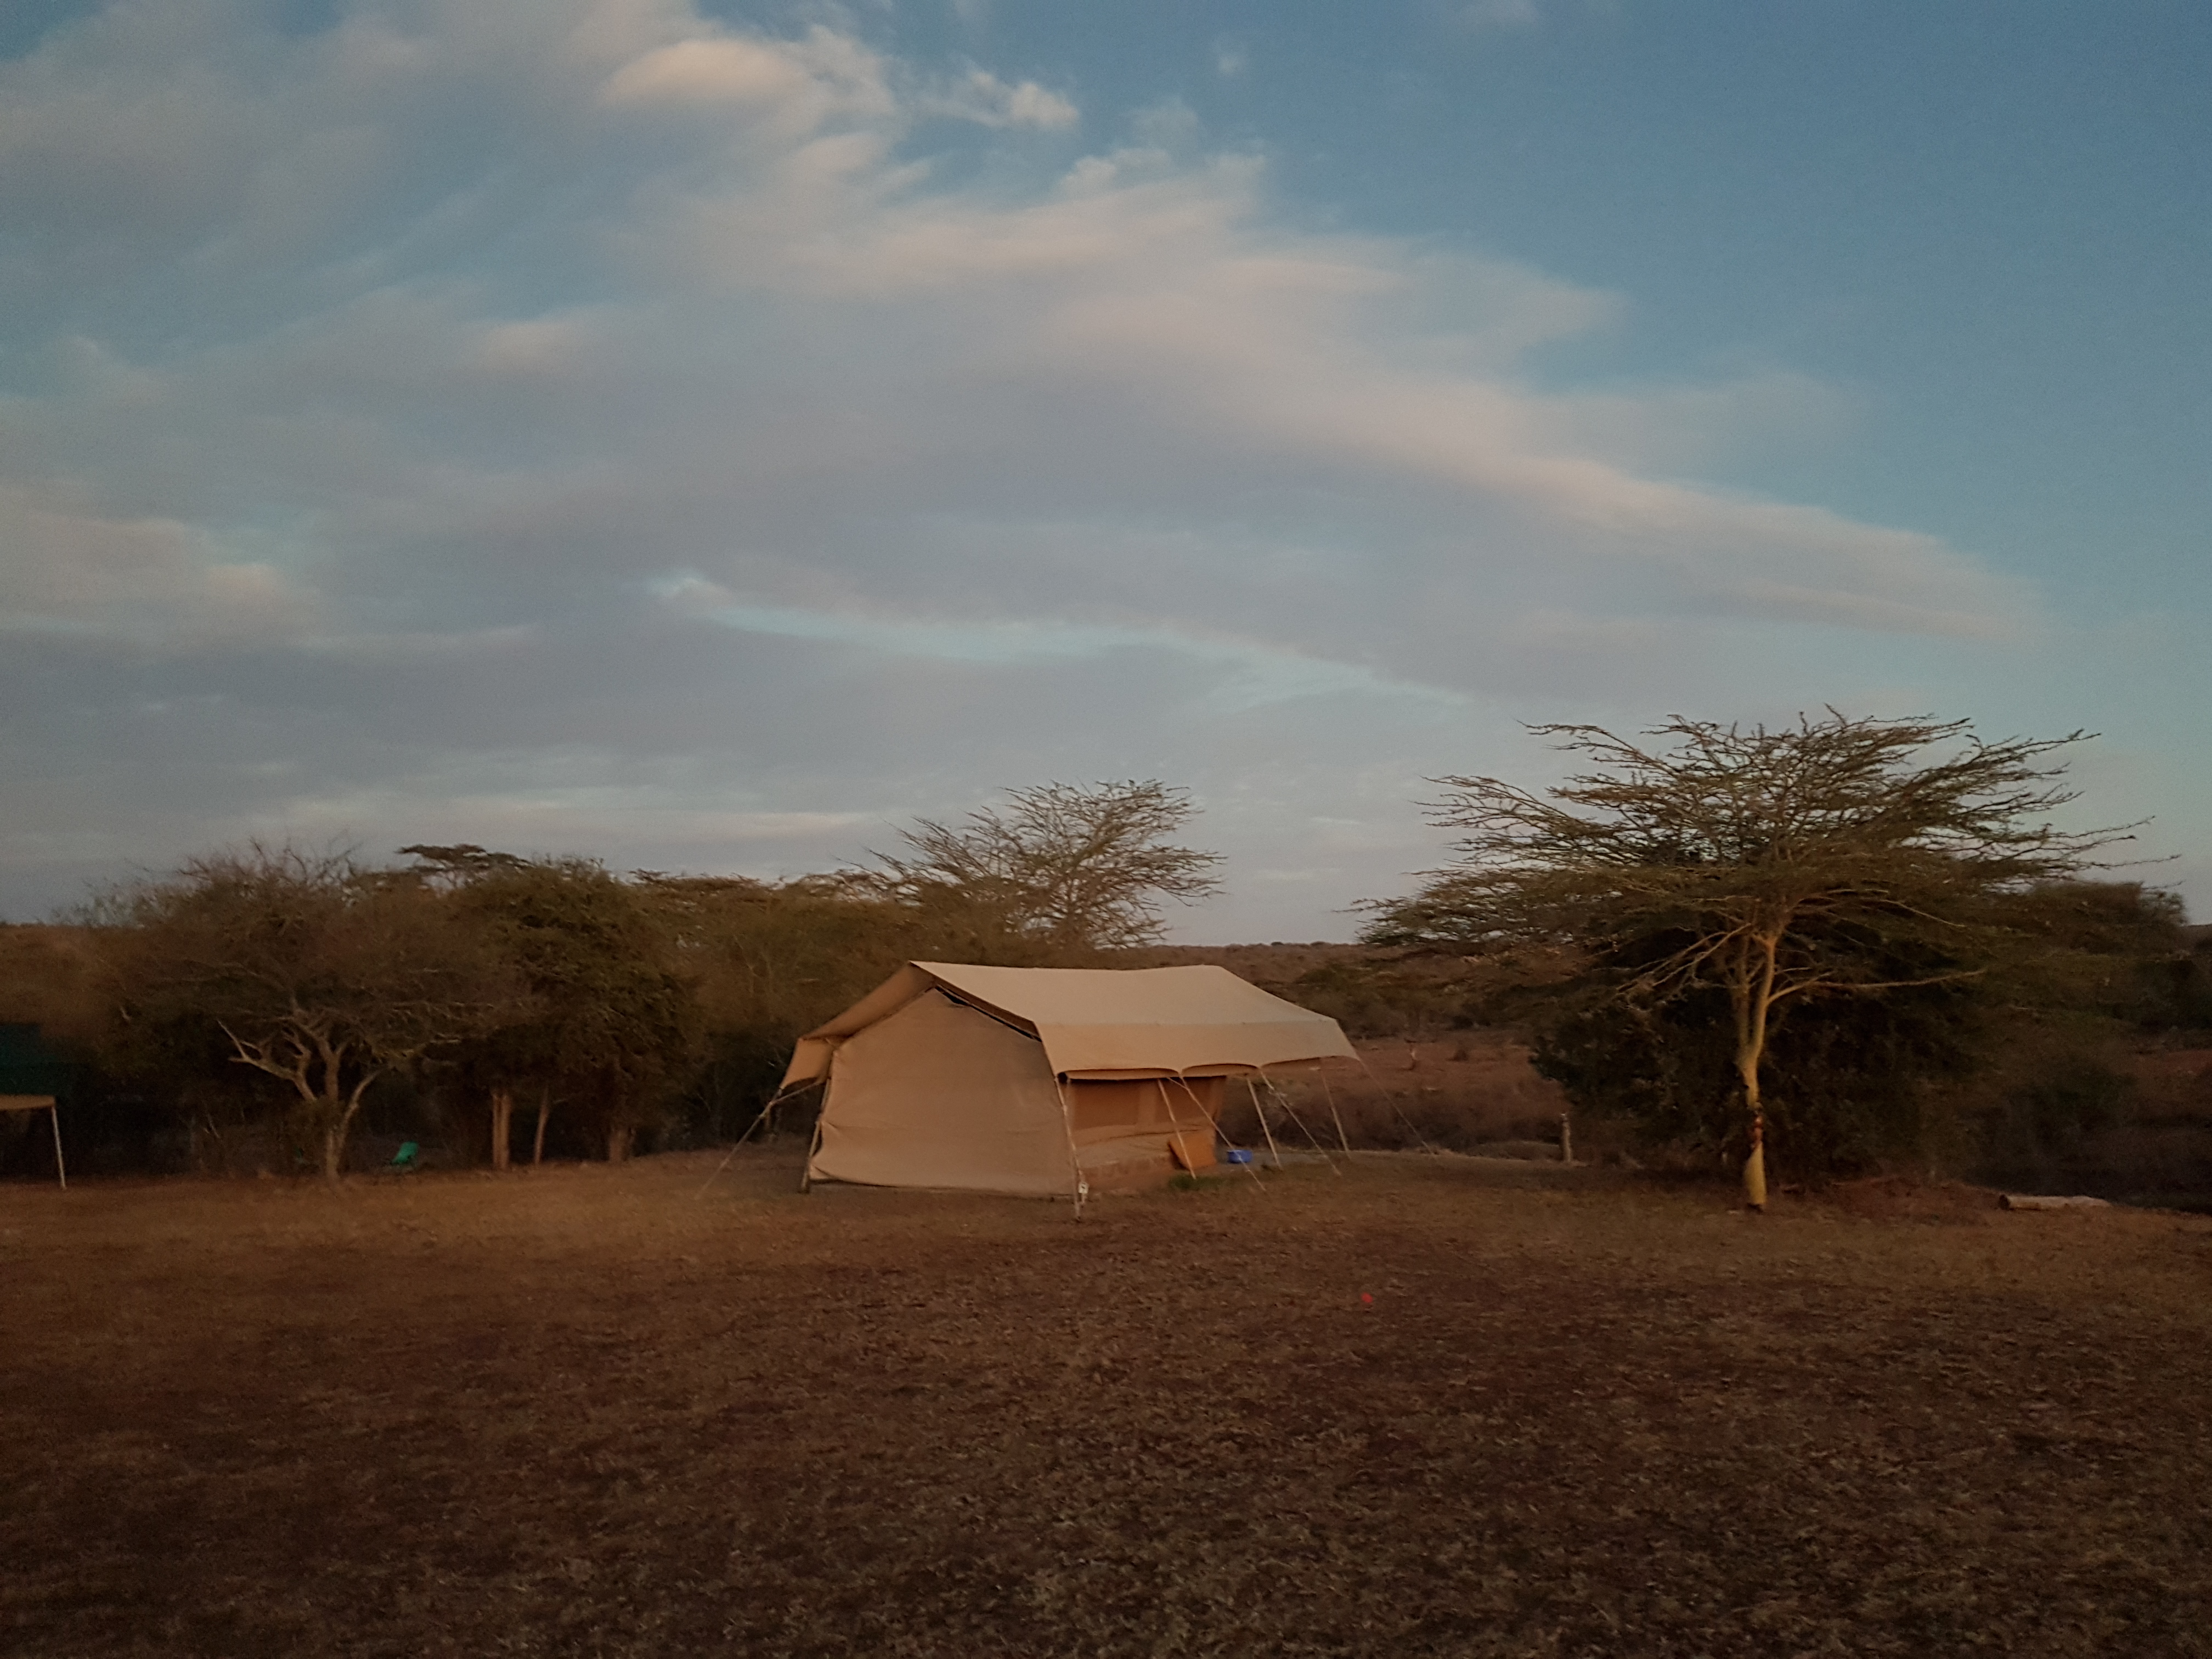
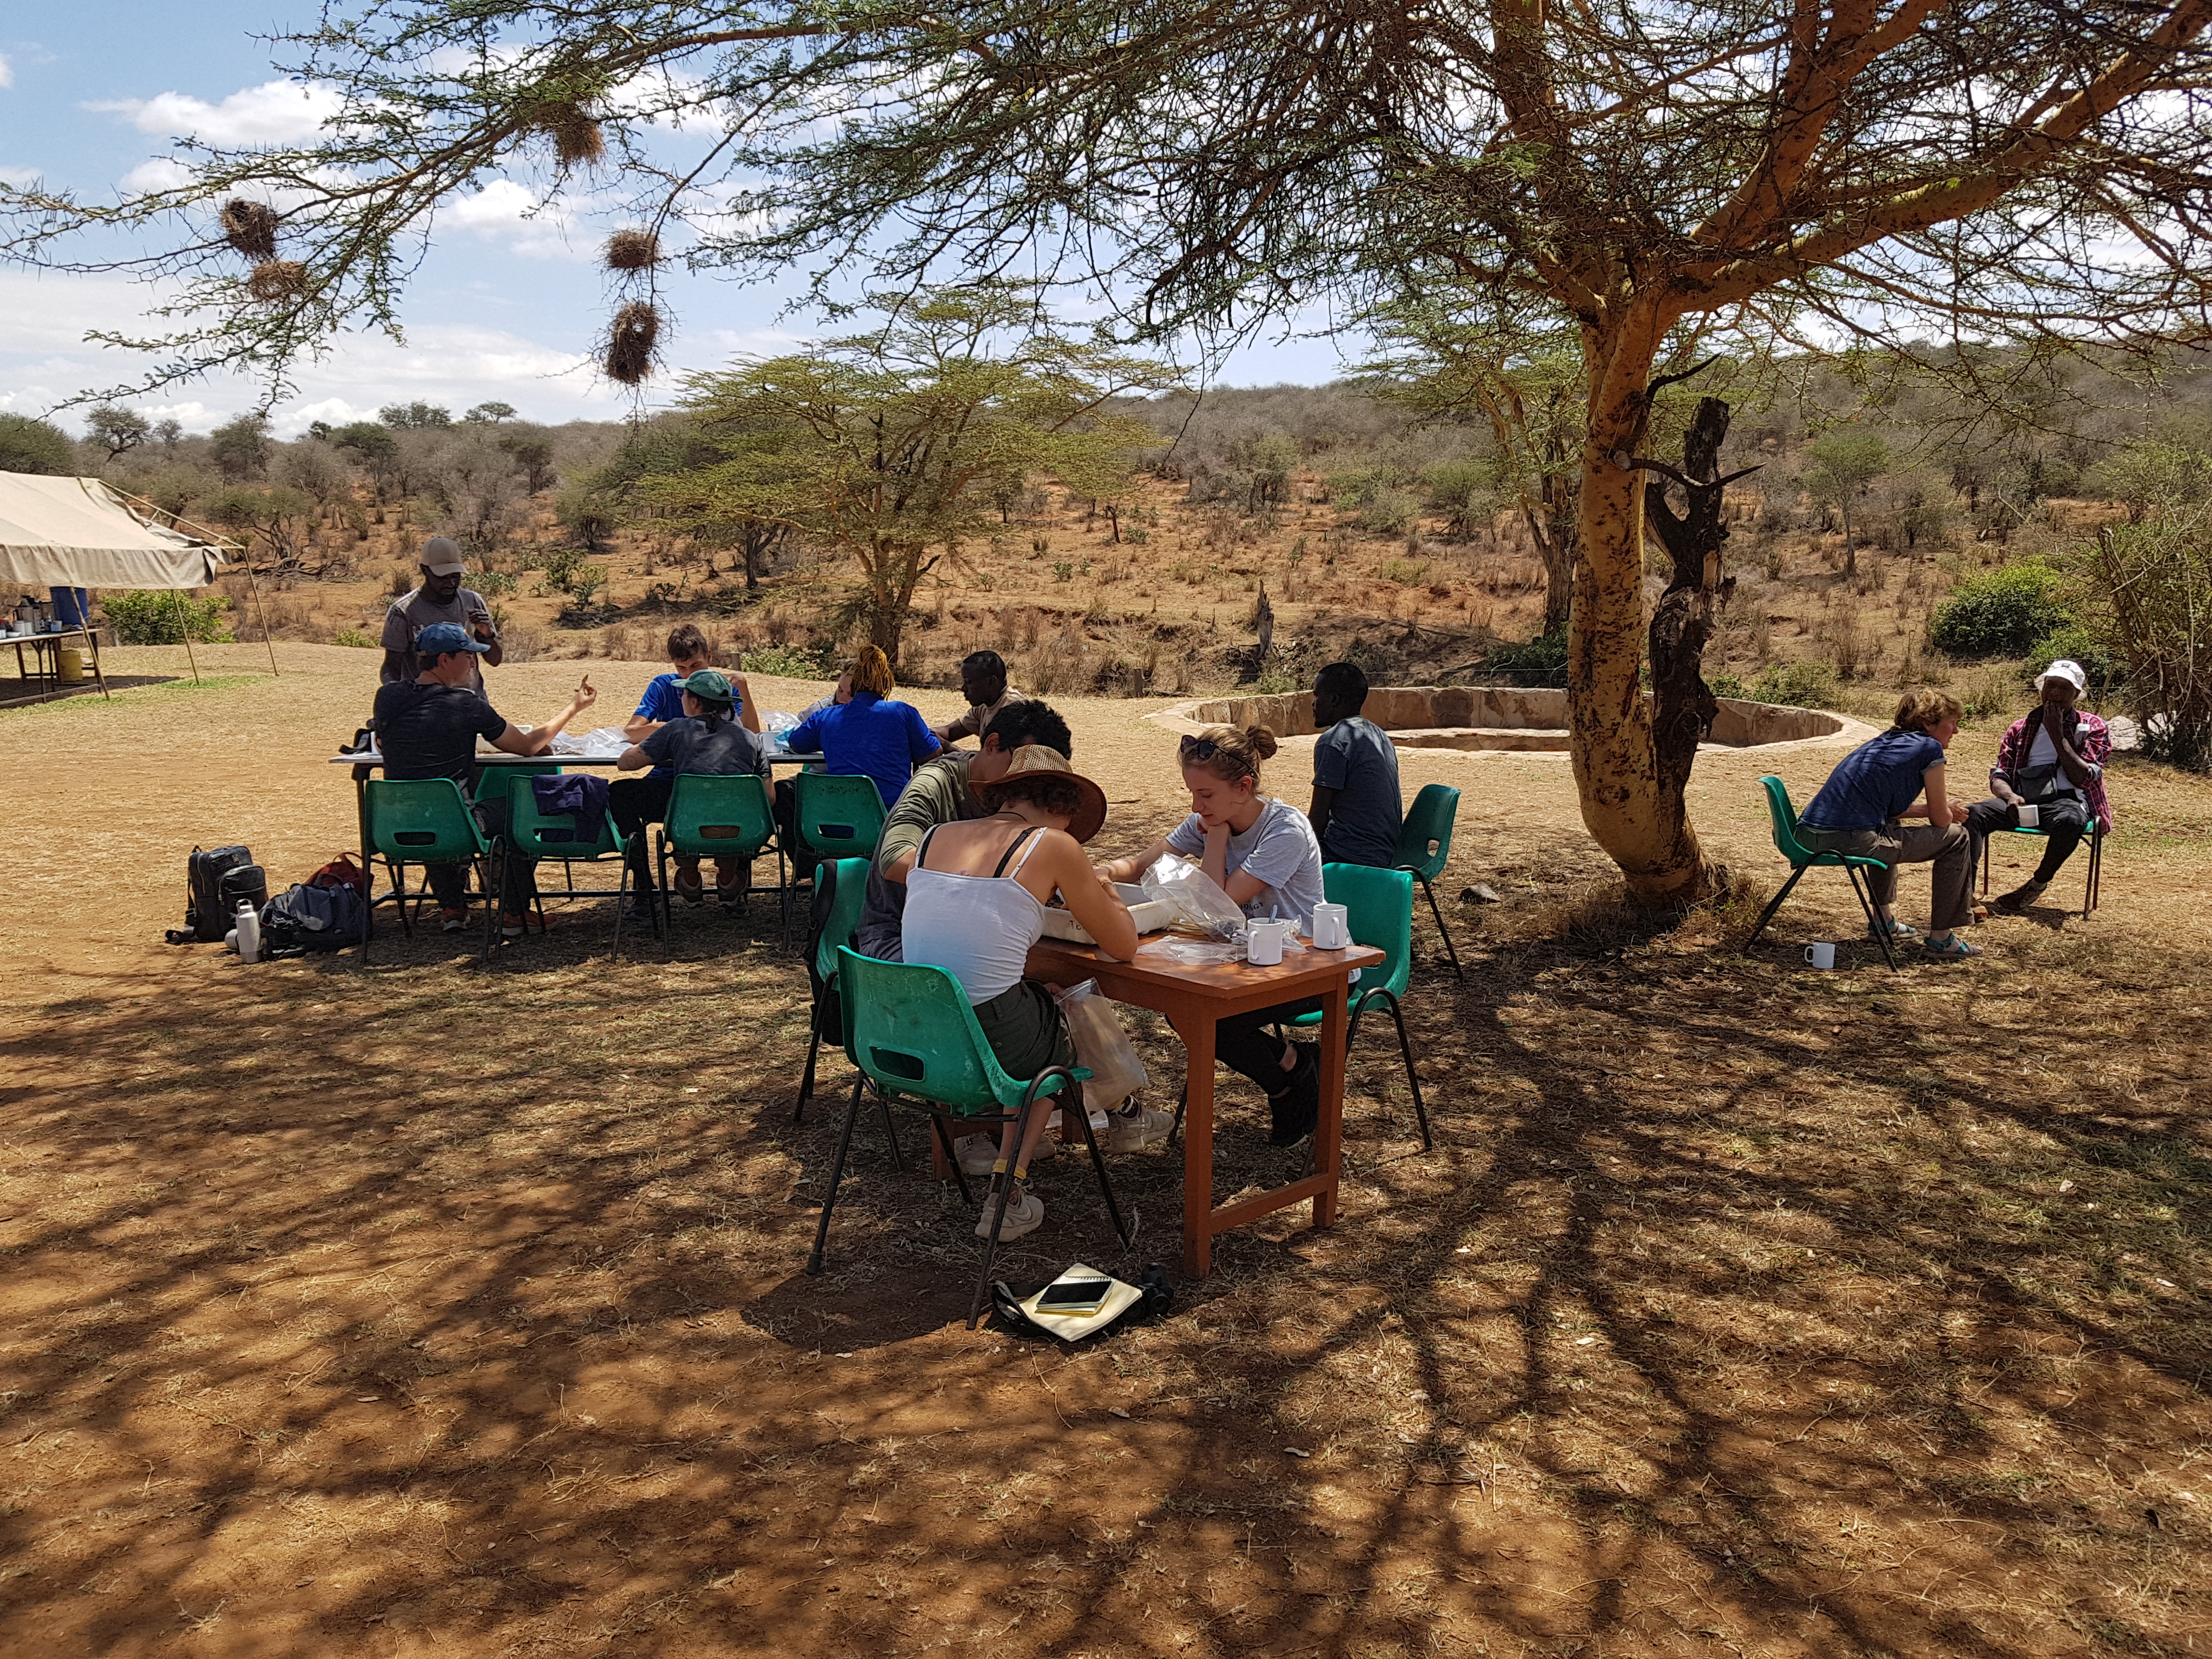
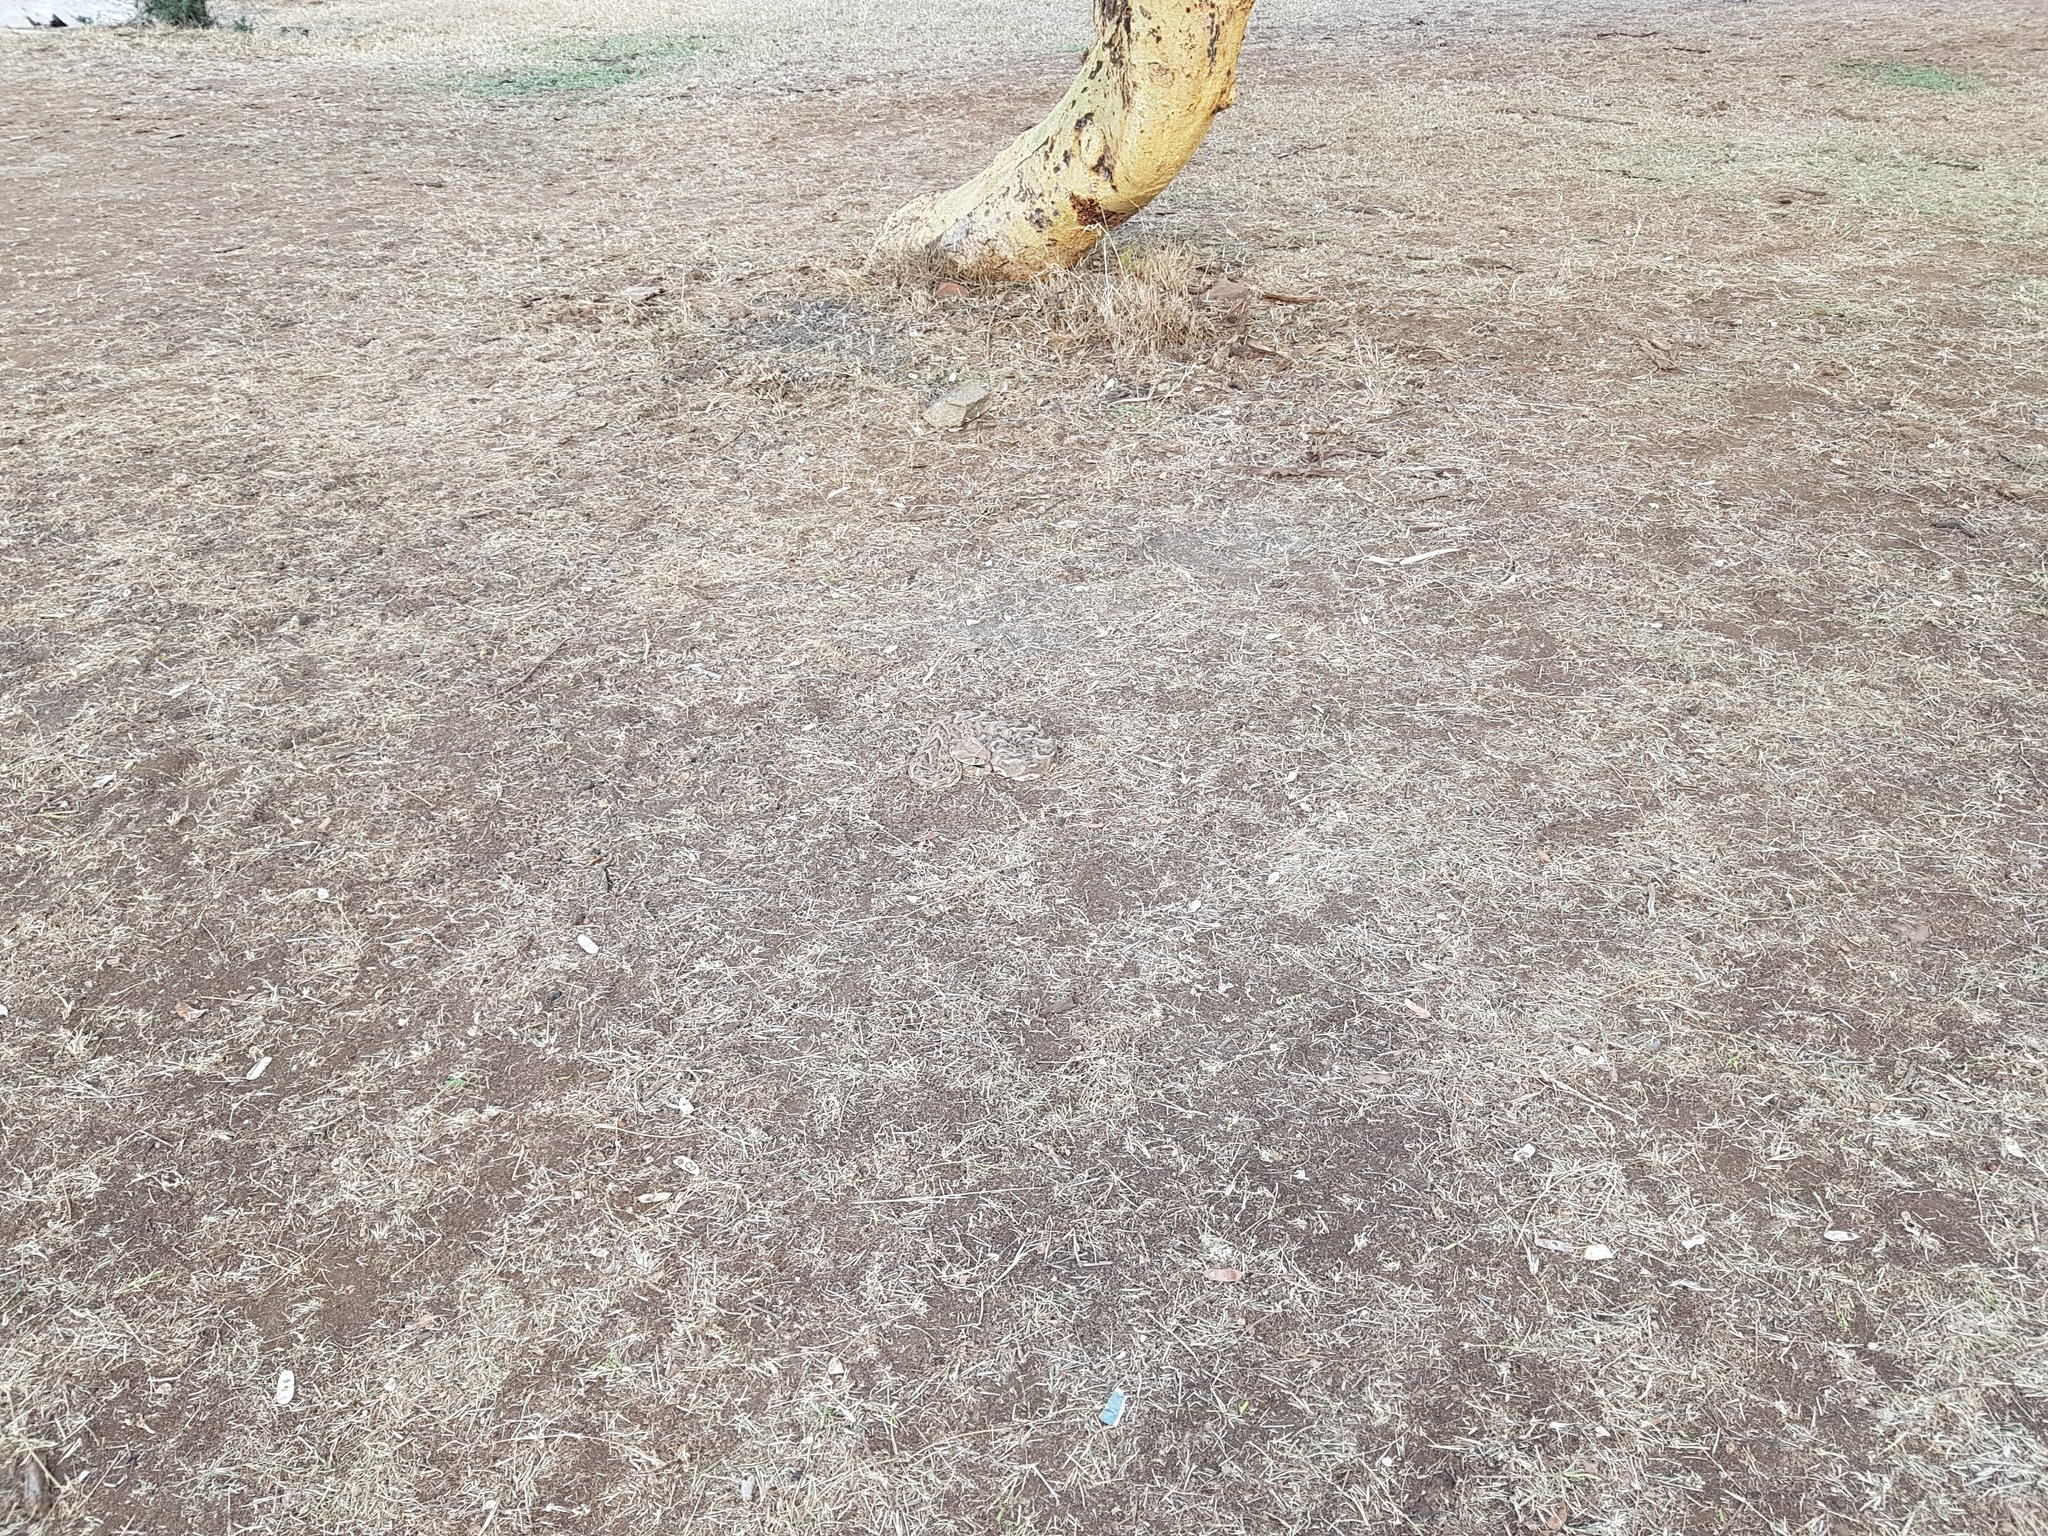
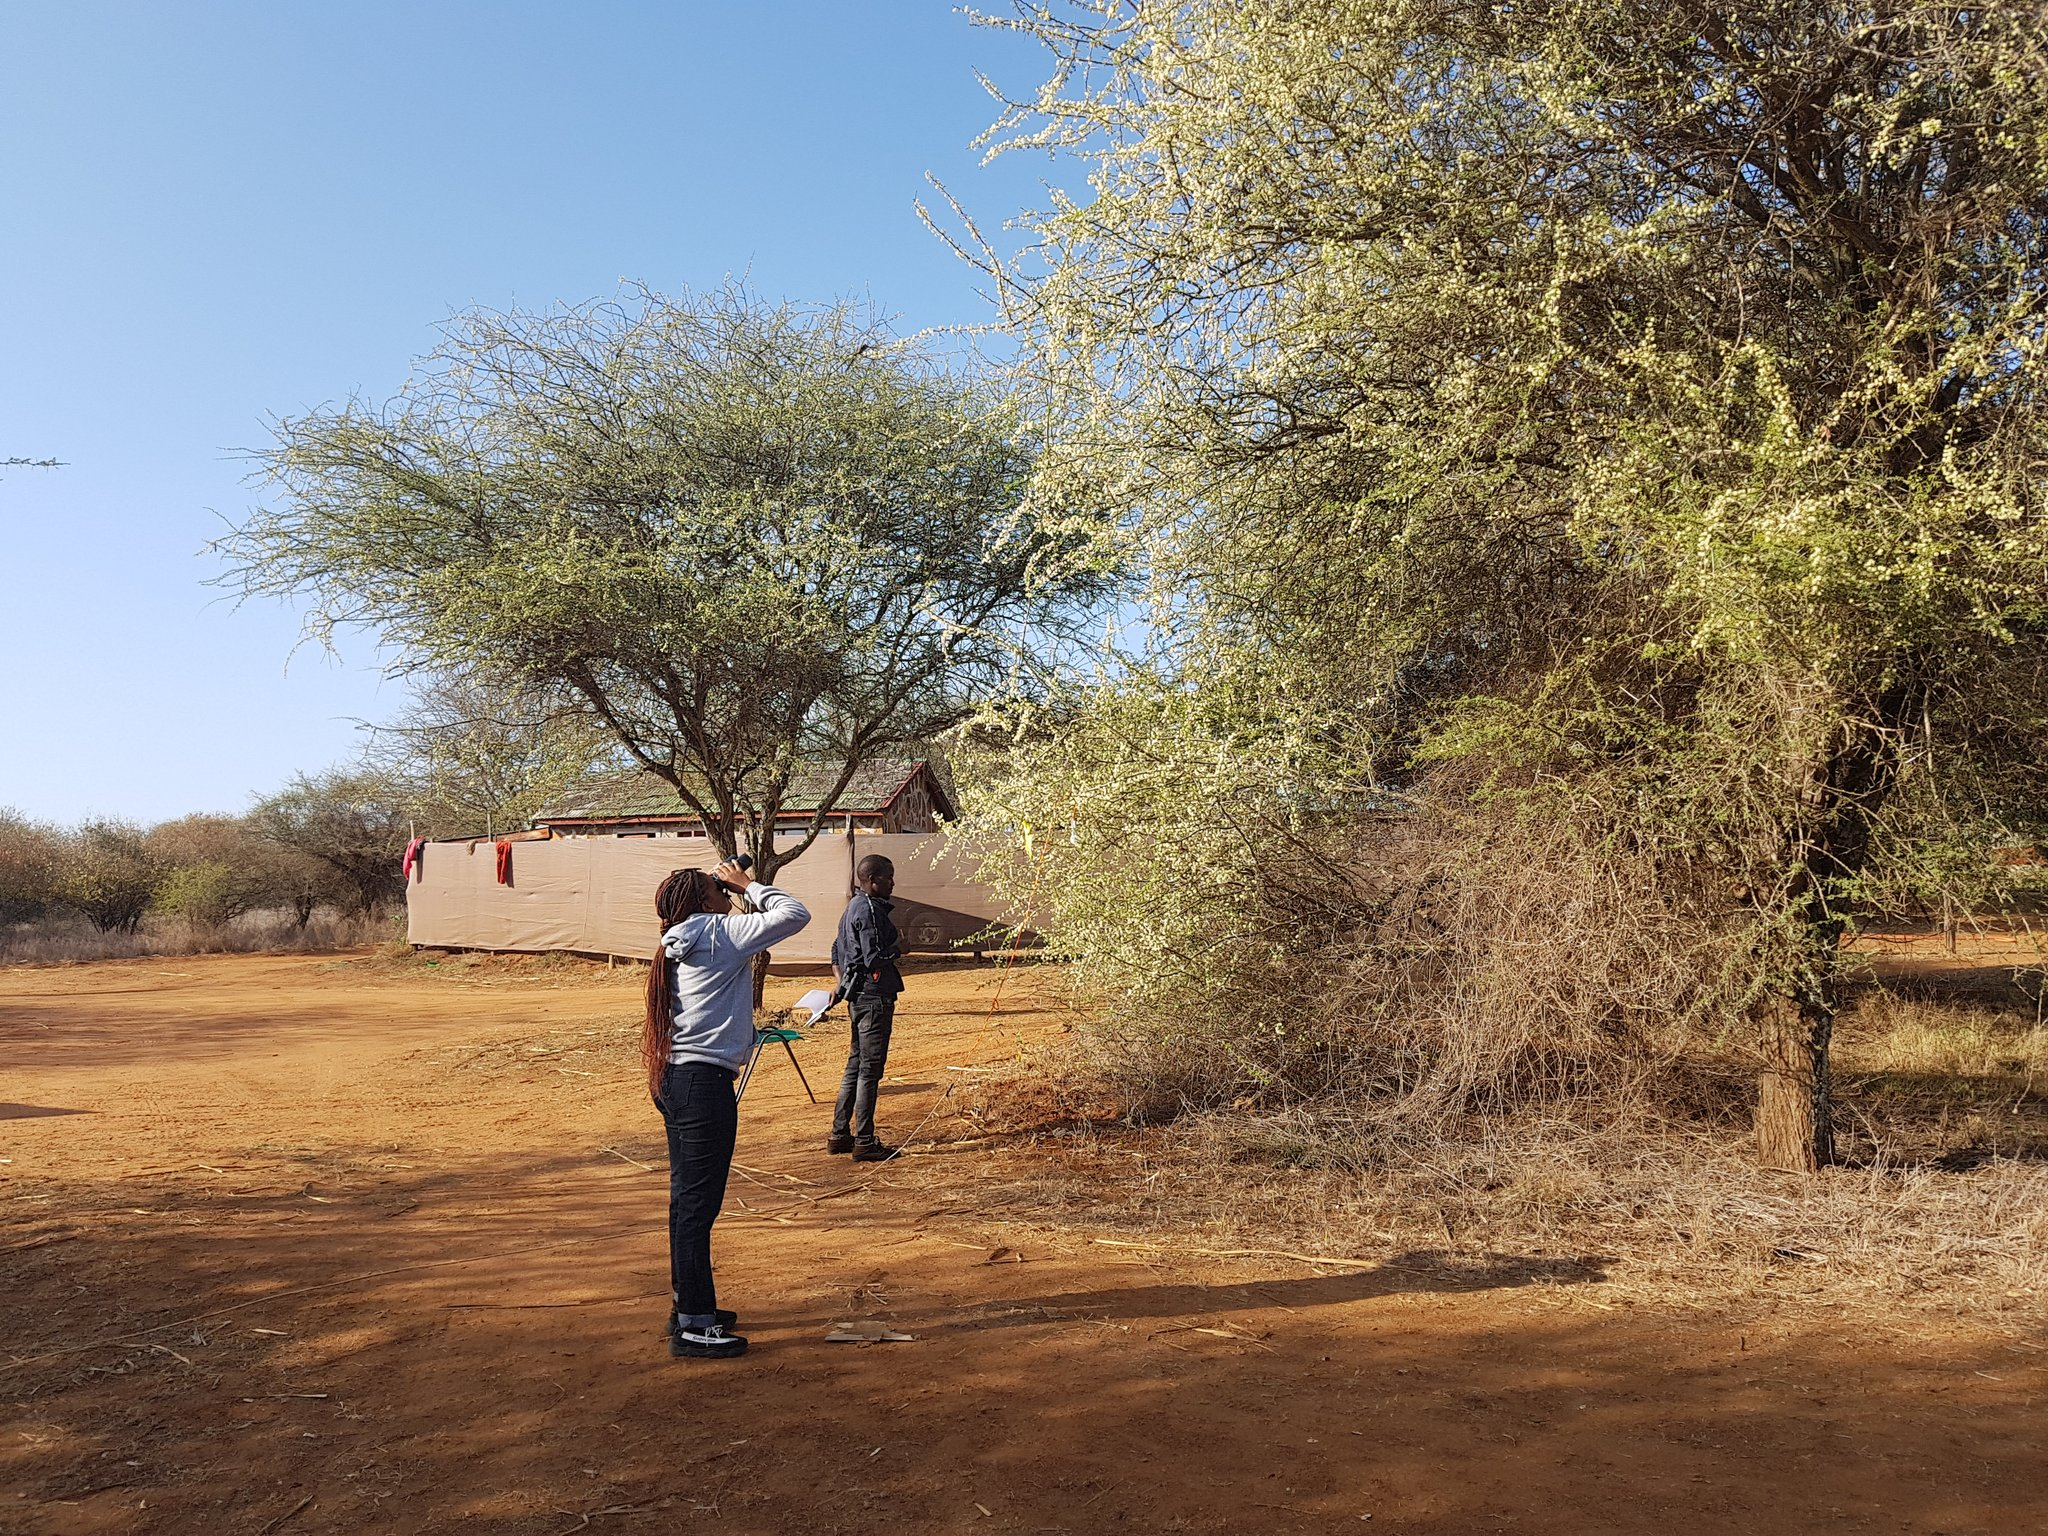
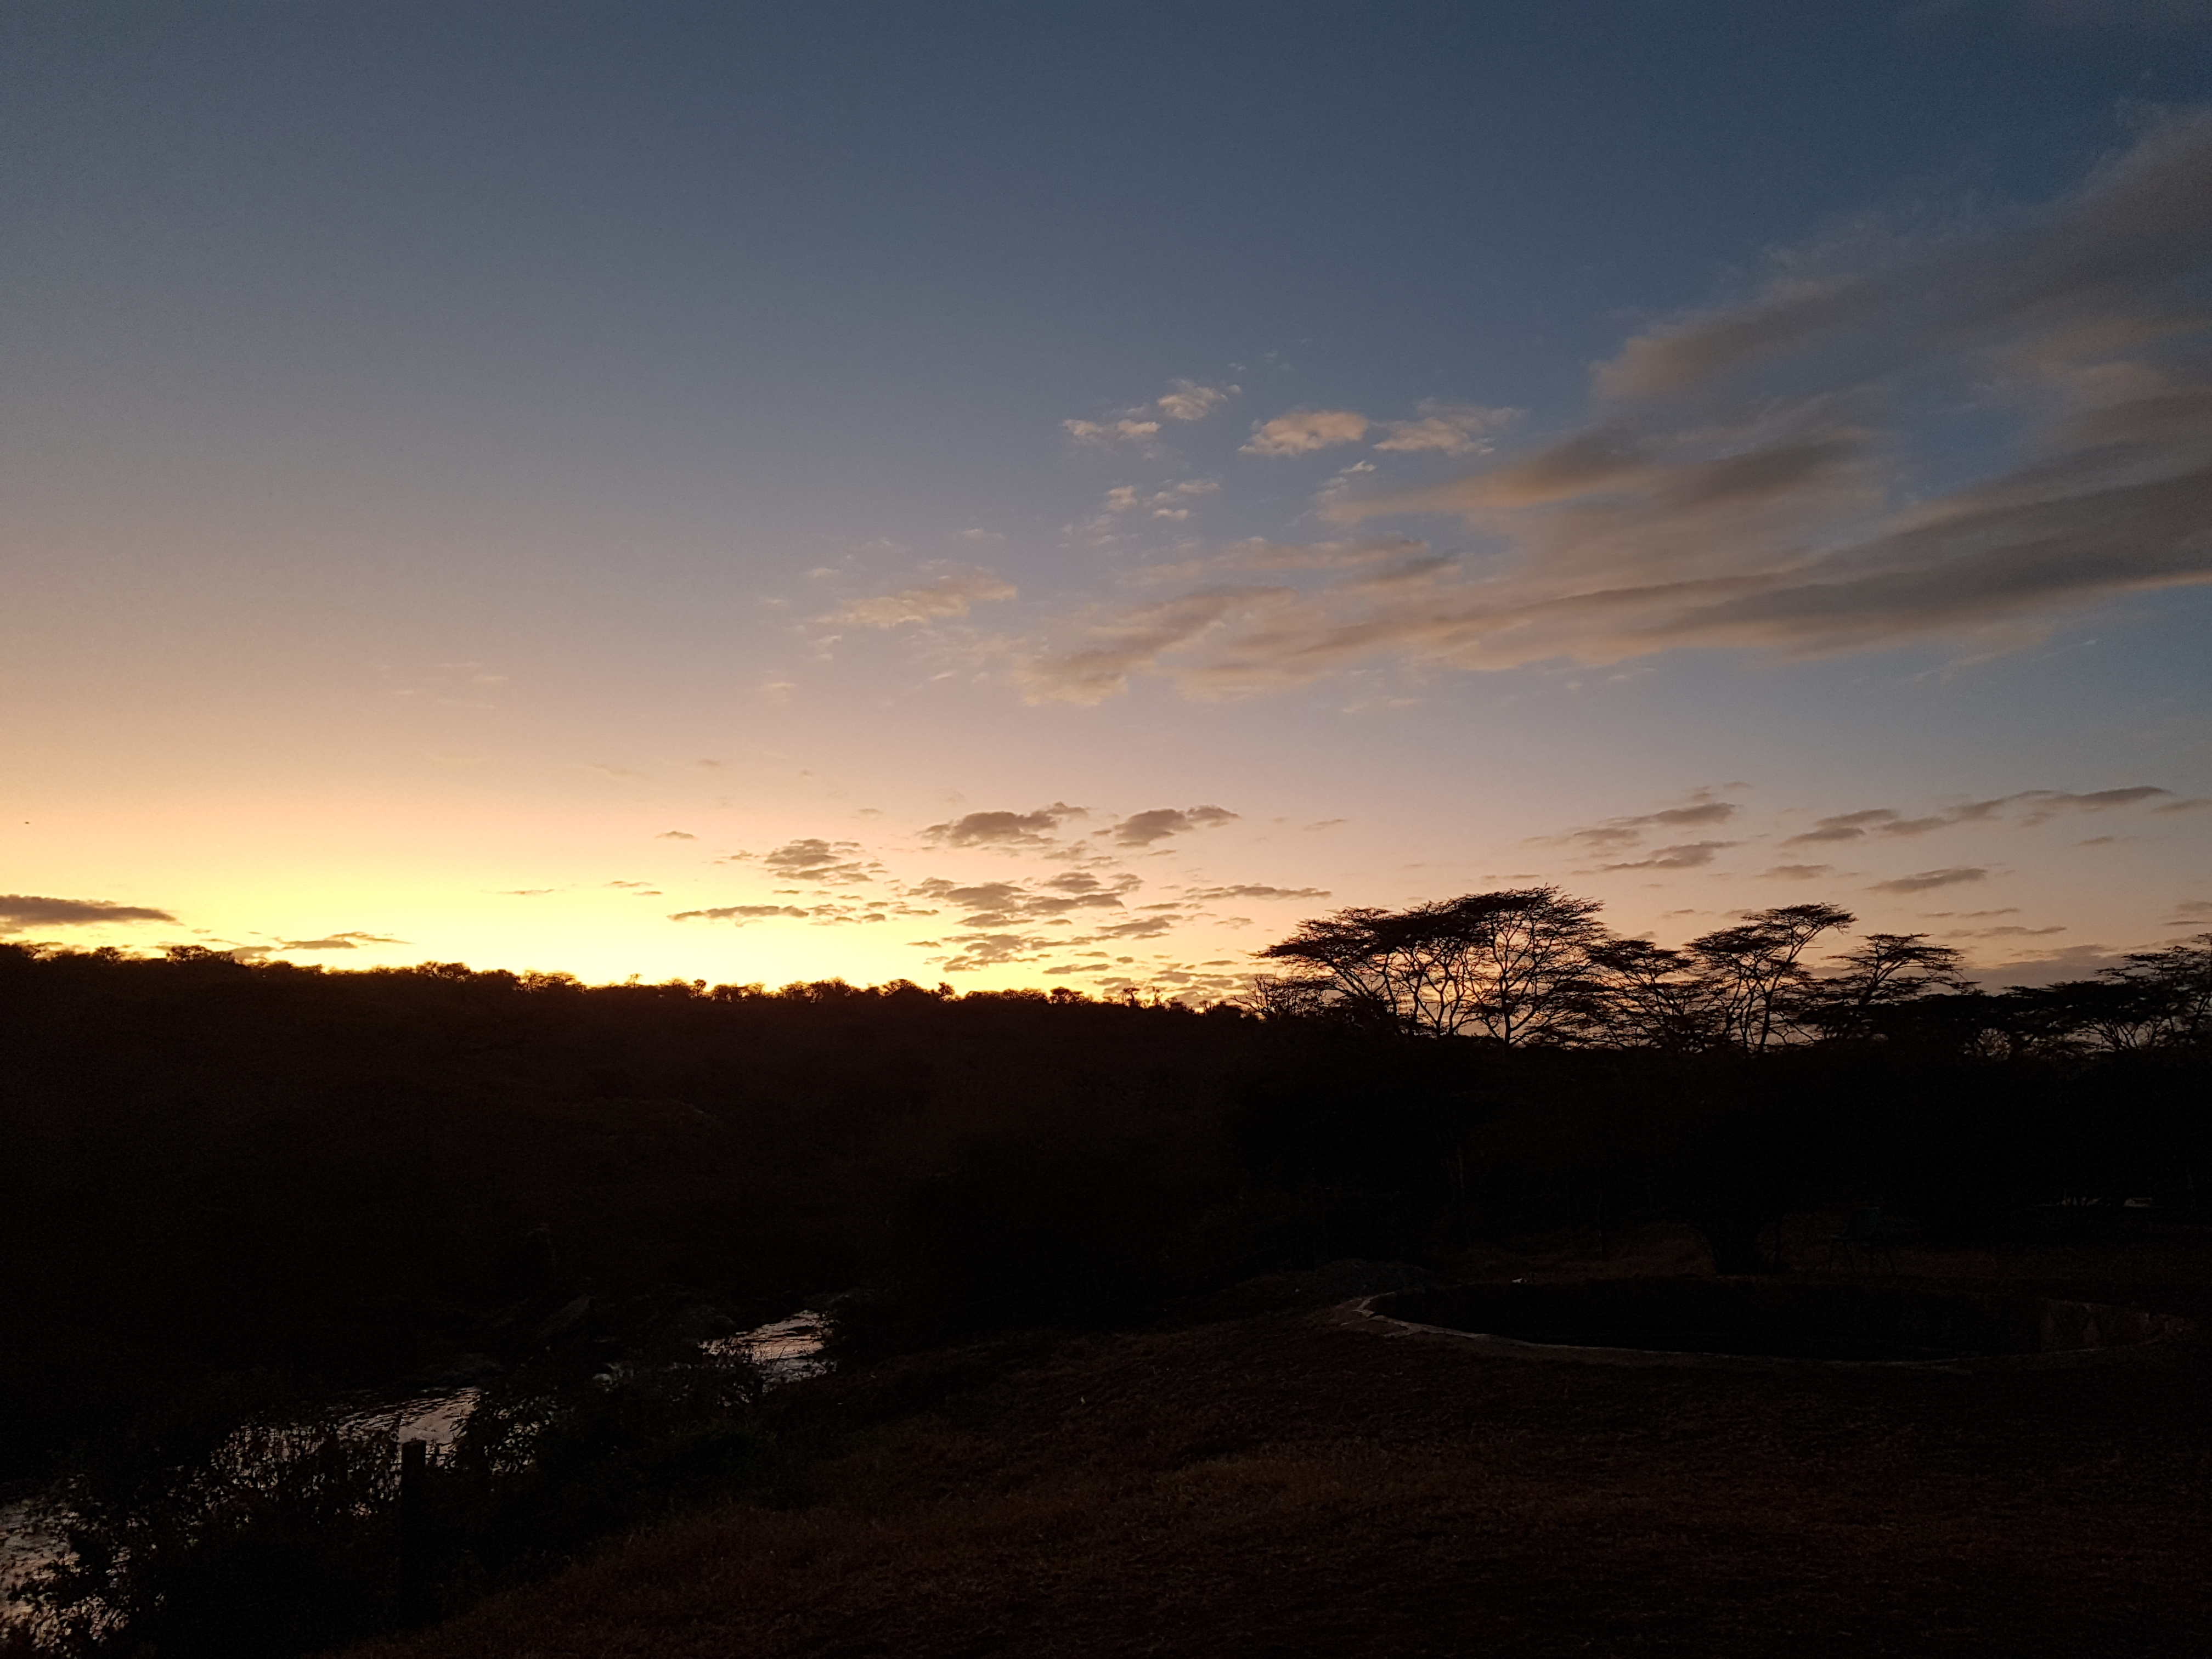
Invasive Prickly Pears (Opuntia spp.) are a growing problem in Kenya, where the cochineal bug has been introduced to help control them.Although there’s an electric fence around the camp site, antelope such as Kudu and Dik Dik are regular visitors. This tent has been our home for most of August. Early in the trip we were confined to it when we both caught COVID. There are worse places to recuperate! The students sorting samples in our open-air classroom, while the White-browed Sparrow Weavers tolerate our intrusionsSpot the snake! The Puff Adder is one of the most deadly snakes in Africa. Fortunately one of the students is an experienced herpetologist and qualified to handle these venomous reptiles.As I write, our TBA students are hard at work on their projects. This is Janeth and Swithin who are looking at competition between honey bees and other pollinators on flowers of this Acacia species.Karin in African ornithologist mode!Examining the Kenya Long-term Exclosure Experiment (KLEE) aimed at understanding the role of mega-herbivores in maintaining savanna biodiversityI’ve donated a copy of my book to the TBA’s Africa library and it’s already inspired some student projects.Sunrise on the savanna
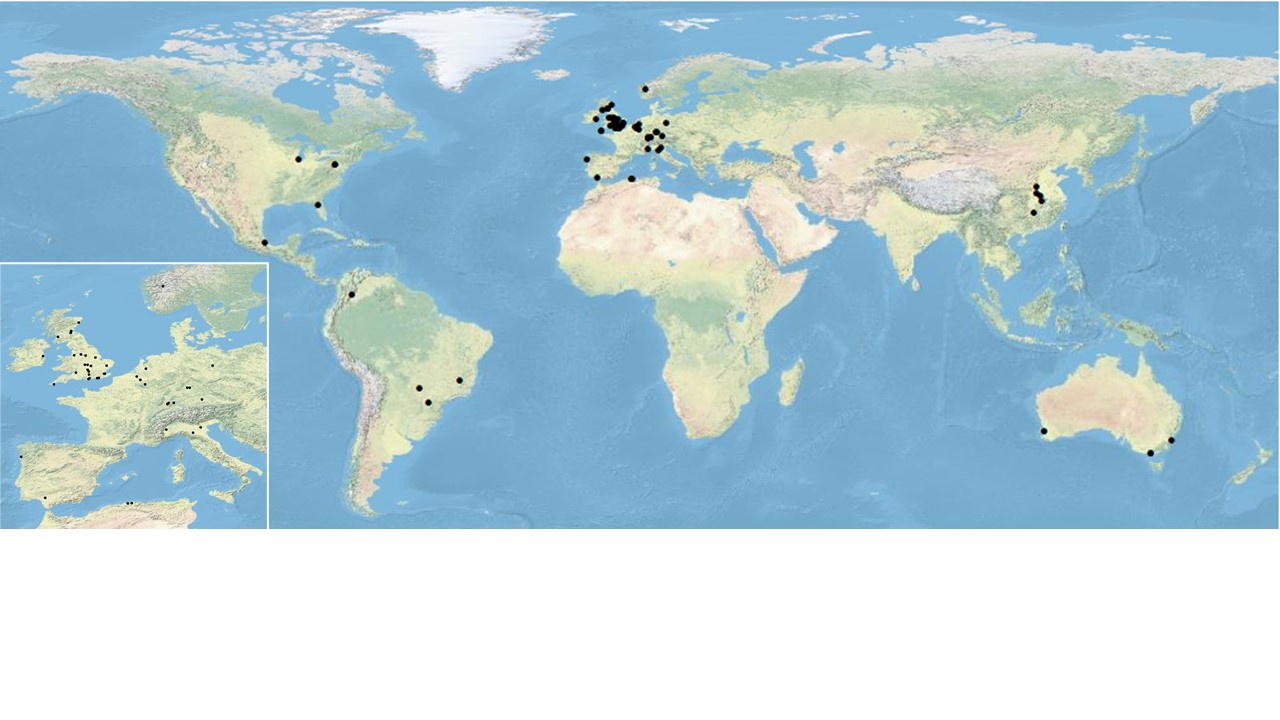
During the lockdown period of the COVID-19 pandemic in 2020, many pollination ecologists were stuck at home: universities and research institutes were closed and restrictions on travel meant that it was not possible to get out and do field work. In order to keep active and motivated, and to turn adversity into an opportunity, an ad hoc network of more than 70 researchers from 15 different countries (see the map above) decided to collect standardised data on the plant-pollinator networks in their own gardens and nearby public spaces.
When combined with information about location, size of garden, floral diversity, how the garden is managed, and so forth, this would provide some useful data about how gardens support pollinators. For those with kids at home it could also be a good way of getting them out into fresh air and giving them something to do!
The resulting data set of almost 47,000 visits by insects and birds to flowers, as well as information about flowers that were never visited, is freely available and will be an invaluable resource for pollination ecologists. For example, analysing the links between ornamental flowers that share pollinators with fruits and vegetables such as apples and beans, will allow us to make recommendations for the best plants to grow in home gardens that can increase yields of crops.
There’s an old saying about turning adversity into a positive outcome: “When life gives you lemons, make lemonade”, and the researchers were pleased to find that there’s one record of Citrus limon in the data set!
The paper describing the data set has just been published in the Journal of Pollination Ecology and you can download a PDF of the paper and the associated data for free by following this link.
Sincere thanks to all of my co-authors for their commitment to the project!
Over the weekend there was a discussion on Twitter about “beewashing” that was spun out of this tweet by London beekeeper Richard Glassborow. Richard and his colleagues are some of the most responsible beekeepers that I know and they are getting increasingly frustrated by claims from irresponsible companies that keeping a hive of bees in your garden will help to “save the bees”, backed up by spurious claims that “honeybee colonies are dying out”.
The Twitter exchange prompted me to produce the Condescending Wonka meme that you see above because, as I discussed in my recent book Pollinators & Pollination: Nature and Society, pollinator conservation is a really complex area. But there’s no doubt that beekeeping as it’s being widely promoted is not the answer to bee conservation. Let me explain why.
The word “honeybee” does not refer to just one species. It’s most often* applied to bees in the genus Apis, especially the Western Honeybee Apis mellifera, but there are another seven or so Apis species to which the word can be applied. Of those other Apis species, most have never been domesticated and they live as free-living colonies is the various parts of Asia where they evolved. Only Apis cerana is kept in hives, as far as I am aware. The conservation status of most of these other Apis species is unclear but given that they are predominantly forest species, and deforestation is a chronic problem in Asia, we can surmise that some species may be declining. If you want to know more about them the Wikipedia page is a good starting point.
In this short post I just want to consider the Western Honeybee (Apis mellifera). This is a really knotty species to get to grips with because there are multiple subspecies and within subspecies there are various genetic lineages. In addition, the Western Honeybee has been subject to artificial selection for desirable qualities, such as docility, amount of honey produced per hive, and disease resistance, as well as cross-breeding between different subspecies**. The best recent summary of our current understanding of Western Honeybee genetics and conservation is this 2019 review by Fabrice Requier and colleagues, from which I’ve drawn quite a bit of information.
For the purposes of this explaining what’s going on, it’s easiest to think about the species as comprising three “megapopulations”:
Western Honeybees that are managed in hives: For the most part these are not endangered. Britain has as many hives now as it did in the mid-1950s and indeed globally we have more hives than ever (about 90 million hives at the last count). They are found far beyond their natural range and have been introduced into places where they are not native such as the Americas, parts of Asia, and Australia. STATUS: doing just fine.
Western Honeybees that have founded “feral” colonies: These have escaped from hives in countries where they have been introduced and become naturalised. They are doing well, too well in fact: they are a significant conservation issue in places like Australia. STATUS: doing just fine.
Western Honeybees that are living wild in their native range: This is where things become a little muddier. The African populations of the various subspecies seem to be doing well, but more studies are needed to confirm this. In Europe, actually defining what constitutes “wild” honeybees across a region where a lot of selection and hybridization has gone on, probably for thousands of years, is tricky. However there’s no doubt that wild colonies of Apis mellifera are not uncommon in suitable woodland: see this paper about free-living colonies in Ireland by Keith Browne and colleagues, for instance. Note their statement that genetic evidence shows that “the free-living population sampled is largely comprised of pure A. m. mellifera“, i.e. the European Black Honeybee. STATUS: probably doing quite well though more data is needed.
Conclusion: as I said, it’s really complicated and I don’t pretend to have all of the answers, no one does. But what IS clear is that managed Western Honeybees are not declining and keeping yet more hives of them is not going to help us to “Save the Bees”. I’ll leave the last word to Requier et al., whose review I really do recommend: “We argue for the redirection of attention from managed honey bees to the neglected conservation of wild honey bees.” Amen to that.
———————————————————————————————
*The term “honeybee” is sometimes also used for other social bees that produce honey, for example stingless honeybees in the genus Trigona, but there’s no real consensus on what “honey” actually is, and as I’ve argued in another post, bumblebees (Bombus spp.) also produce honey.
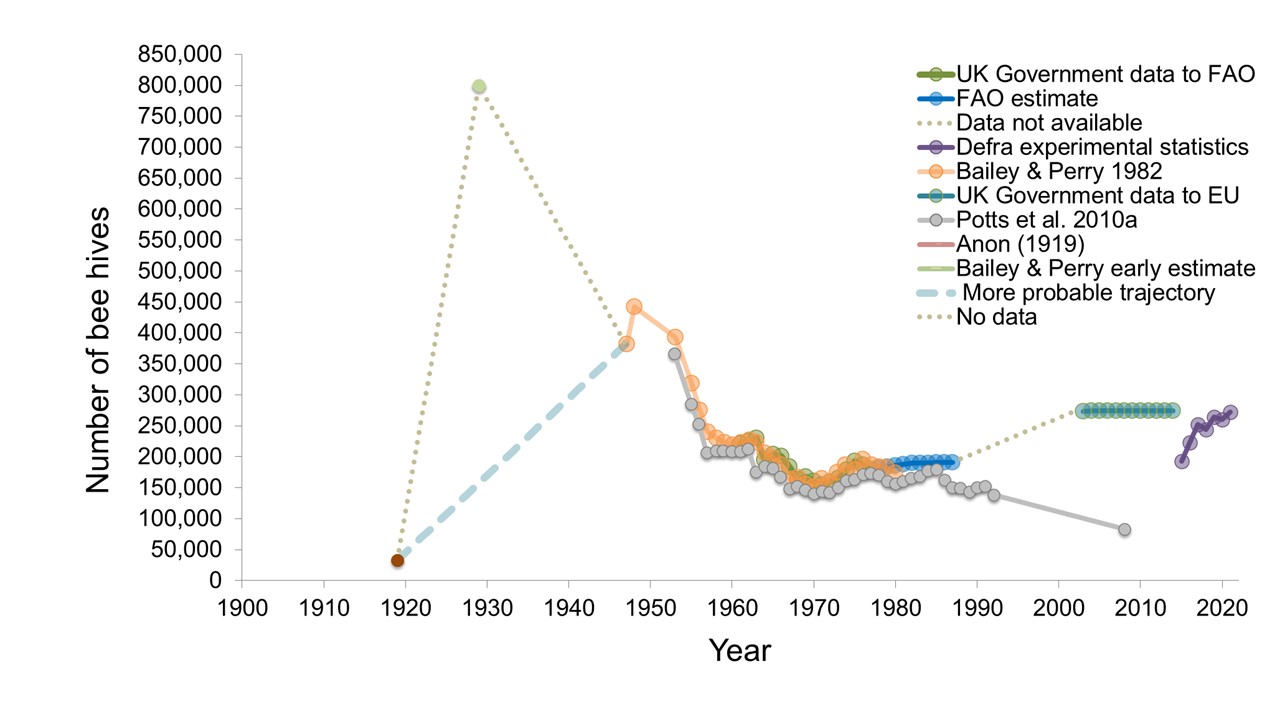
If you’ve read my book Pollinators & Pollination: Nature and Society you’ll know that I have a section in the chapter “The shifting fates of pollinators” that deals with the honey bee situation. In that section I bring together the most comprehensive data set so far available on changes in number of hives in Britain. It’s based on a couple of earlier blog posts and if you’ve not read my book take a look at this one first and then this one to give you some context and more information about the sources of the data.
So far this year I have had several requests from people for the original data (which I’m happy to supply) and queries about what it means. So I thought that the time was right to update the graph with the latest official government figures from BeeBase.
The graph above brings the story up to 2021 where the official estimated number of hives is 272,631. That’s an increase of more than 40% since the first BeeBase estimate in 2015.
The take home from this figure is that the current number of honey bee hives in Britain is similar to what it was in the mid-1950s.
So the answer to the question “have honey bees declined in Britain?” is a resounding NO! They are at least as abundant as they were almost 70 years ago. This reflects the global situation where there’s been a substantial increase in hive numbers since the 1960s, as you can see in the figure below.
So if you want to “Save the Bees” or otherwise support pollinators, please focus on the wild, unmanaged species rather than the managed Western Honeybee (Apis mellifera). As always, comments and questions are welcome below or send me a message via my Contact page.
One of the projects with which I’ve been involved over the last year has been advising on a new book for children about bees and other pollinators, called Can We Really Help The Bees? Written by Katie Daynes and wonderfully illustrated by Róisín Hahessy, it tells the story of what happens when a swarm of bees comes to the window to let a group of children know that they, and their friends the other pollinators, are in trouble. Can they help? Yes they can!
It’s been a real pleasure working with Katie and Róisín on this project for Usborne Publishing and seeing the ideas, text, and illustrations evolve over time. I’ve written a short post over at the Usborne blog with some ideas about how to get children involved in helping the pollinators, and I think that it’s worth repeating one of the things that I wrote: everyone can make a difference to the wildlife around us and no one is too young to be involved!
Because of my involvement with Can We Really Help The Bees? I wasn’t able to include it on my curated list of the best books about bees and other pollinators at the Shepherd site. But it definitely should be on there and is highly recommended!
Recently Phil Stevenson and I advised on an art/science project called Minus Pollinators which considered what a small café menu might look like if there were no pollinators to help produce the many, many fruits and vegetables and nuts that are animal pollinated.
The project is a collaboration between writer and consultant Max Fraser and artist Freddie Yauner. To quote Freddie’s description on his website, the project represents:
A dystopian future in the form of a drinks kiosk where the staples such as coffee, teas, juices, chocolate etc. are no longer available due to pollinator decline…the mobile drinks kiosk acts as an exhibition display, with artworks painted in pollen…and a take-away pamphlet…detailing the importance of insect pollinators for our collective future on this planet.
Minus Pollinators was commissioned as part of a summer-long event called Food Forever at the Royal Botanic Gardens, Kew, after which it goes to the Groundswell festival.
It was a pleasure to work with Max, Freddie and Phil on this because art/science projects are a great way of getting the message across about the importance of biodiversity and the current environmental crisis that we are facing.
In my recent book Pollinators & Pollination: Nature and Society I discussed the current state of our knowledge of how populations of pollinators have changed over time. Although we have some quite detailed data for particular, often charismatic, species or for certain geographic localities or regions, for most species we know almost nothing. As I wrote in the chapter “The shifting fates of pollinators”:
“For most pollinators we are ‘data deficient’, in other words, we don’t know how their populations are performing. They could be doing well, but they may not be”
This is particularly true for those regions for the world that hold the greatest terrestrial biodiversity: the tropics. For the vast majority of species in the tropics we know precious little about trends in their populations and how their distributions have changed over time in the face of wide-scale land transformation and recent climatic shifts. Filling in some of the gaps in our knowledge of Neotropical pollinator distributions is one of its aims of SURPASS2, a collaboration between South American and UK ecologists, and one of several research and outreach projects with which I’m involved.
In a new study that’s come out of that work, led by Rob Boyd from the UK Centre for Ecology and Hydrology, we’ve used the GBIF database to look at the changing distributions of four important groups of pollinators: bees, hoverflies, leaf-nosed bats and hummingbirds. In particular we were interested in understanding the kinds of biases that come with such publicly available data, and whether recent efforts to add data to GBIF has improved our understanding of trends.
Our overall conclusion is that there are significant limitations and biases inherent in all of these data sets even for groups like hummingbirds which one would imagine are well documented by scientists and bird-watching naturalists. In addition, having more data does not necessarily help matters: it can introduce its own biases.
The paper is open access and feely available; here’s the reference with a link:
Aim Aggregated species occurrence data are increasingly accessible through public databases for the analysis of temporal trends in the geographic distributions of species. However, biases in these data present challenges for statistical inference. We assessed potential biases in data available through GBIF on the occurrences of four flower-visiting taxa: bees (Anthophila), hoverflies (Syrphidae), leaf-nosed bats (Phyllostomidae) and hummingbirds (Trochilidae). We also assessed whether and to what extent data mobilization efforts improved our ability to estimate trends in species’ distributions.
Location The Neotropics.
Methods We used five data-driven heuristics to screen the data for potential geographic, temporal and taxonomic biases. We began with a continental-scale assessment of the data for all four taxa. We then identified two recent data mobilization efforts (2021) that drastically increased the quantity of records of bees collected in Chile available through GBIF. We compared the dataset before and after the addition of these new records in terms of their biases and estimated trends in species’ distributions.
Results We found evidence of potential sampling biases for all taxa. The addition of newly-mobilized records of bees in Chile decreased some biases but introduced others. Despite increasing the quantity of data for bees in Chile sixfold, estimates of trends in species’ distributions derived using the postmobilization dataset were broadly similar to what would have been estimated before their introduction, albeit more precise.
Main conclusions Our results highlight the challenges associated with drawing robust inferences about trends in species’ distributions using publicly available data. Mobilizing historic records will not always enable trend estimation because more data do not necessarily equal less bias. Analysts should carefully assess their data before conducting analyses: this might enable the estimation of more robust trends and help to identify strategies for effective data mobilization. Our study also reinforces the need for targeted monitoring of pollinators worldwide.
——————————————————–
SURPASS2 has been a hugely productive project as you’ll see if you look at the Publications page of the website. There’s much more to come and I’ll report on those research papers as they appear.