Author Archives: Jeff Ollerton

Unknown's avatar

About Jeff Ollerton

Independent consulting scientist and author, working on understanding and conserving biodiversity

Animal deaths in the Australian bushfires even greater than first feared – and what about the plants?

2019-12-27 15.07.16

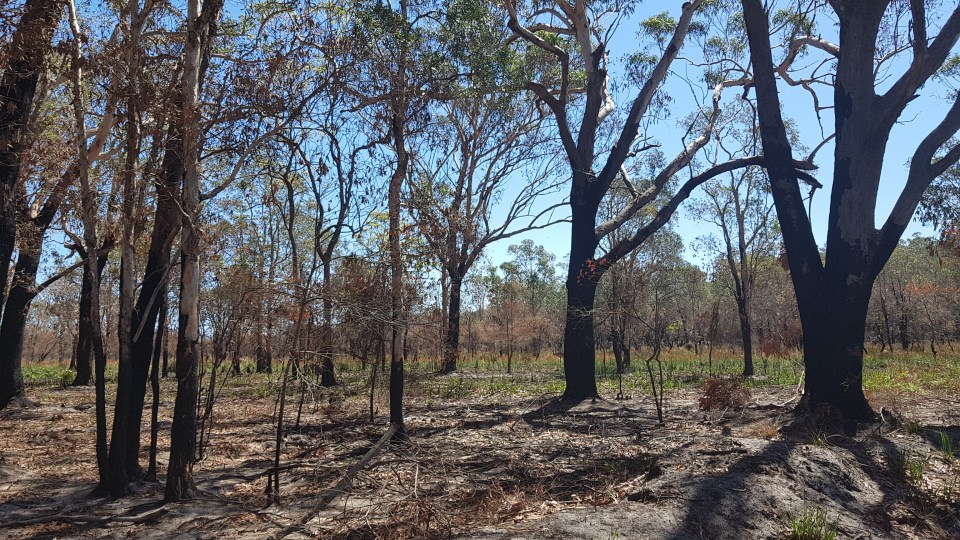
Earlier this year I reported on the unprecedented Australian bushfires with some reflections of what I was observing during my time as a Visiting Research Fellow at the University of New South Wales – see: How are the Australian bushfires affecting biodiversity? Australia reflections part 4.   Karin also wrote a piece about the fires, focusing on the human impacts – see: Climate Change Stories From a Nation on Fire.

At the time scientists and the media were suggesting that perhaps half a billion reptiles, mammals and birds had been killed, a figure that provoked a strong public reaction when accompanied by images of fire-scorched koalas.  This was then revised upwards to 1 billion. But it turns out that even a billion is nowhere close to the real number of animal deaths.  A new interim report commissioned by WWF-Australia suggests that just under 3 billion animals were either directly killed or displaced.  Those which were displaced were vulnerable to feral predators such as foxes and cats, or more likely to succumb to starvation. An article in The Guardian about the WWF-Australia report is worth reading – here’s the link.

The actual figure is 2.69 billion individual animals.  Think about that for a moment.  That’s about equivalent the number of people living in India and China combined.  This is the breakdown for the different animal groups that were assessed:

● 143 million mammals
● 2.46 billion reptiles
● 180 million birds
● 51 million frogs

One thing should be immediately apparent: this is not a complete list of the “animals” that have been killed.  A lack of data means that fish, turtles and (crucially) invertebrates such as spiders, bees, beetles, and earthworms, were excluded.  Those invertebrates live at much higher densities than any of the animal groups that were assessed and indeed are the sole or principle food for many of those species.  The number of insects required to support just the insectivorous birds is staggering: globally, birds are estimated to eat 400-500 million tonnes of insects and other arthropods every year.

Even if we were to consider just the larger invertebrates, those bigger than say 0.5 cm in length (which are a minority – most are considerably smaller), then then the true scale of the animal deaths is going to be one or two orders of magnitude higher.  Or possibly more.  Thirty billion, 300 billion, 3 trillion…?  Who knows?  It’s impossible to estimate, we just don’t have enough information about those organisms.

The other major component of wildlife that is missing from the report is the plants.  I know that studies of plant mortality are being undertaken at the moment and it will be important that this is given the same level of publicity as the assessments of animals.

Writing in the foreword of the report, Dermot O’Gorman the CEO of WWF-Australia pointed out that: “It’s hard to think of another event anywhere in the world in living memory that has killed or displaced that many animals. This ranks as one of the worst wildlife disasters in modern history”.

I disagree.  I think it’s THE worst wildlife disaster in terms of the scale of animal losses over such a short period of time.  No doubt deforestation and destruction of grasslands in South America, Asia and Africa has killed more animals and plants.  But that’s over a timescale of decades to hundreds of years.  Australian wildlife was devastated in a matter of months. And no one knows exactly what the 2020-21 fire season will bring.  But I think that we can safely predict further impacts on wildlife – and people.


A simple online ecosystem model: like Tamagotchi for the green generation

Orb farm

Recently I came across an online game based on a simple cellular automaton model called orb.farm in which you have to design an enclosed ecosystem that supports plant, animal and bacterial life.  It’s a little bit addictive and a lot of fun! Reminds me of a more sophisticated form of the Tamagotchi, but without the ridiculous waste of plastic, metal and electronics that inevitably comes with these kids’ crazes.

When I tweeted about this earlier in the week the most excitement was generated by some scientists who actually work in lake ecosystem ecology.  They were very impressed!  The occasional Easter Eggs that appear also keep you hooked.  Helpfully, you can also close down your browser or computer and your ecosystem is still there when you open it up again.

Orb.farm is by Max Bittker and I hope that he develops it further.  I can see it being used for some serious experiments as well as being educational and fun.

Get a 30% discount if you pre-order my new book Pollinators & Pollination: Nature and Society

PollinatorsandPollination-frontcover

In the next few months my new book Pollinators & Pollination: Nature and Society will be published.  As you can imagine, I’m very excited! The book is currently available to pre-order: you can find full details here at the Pelagic Publishing website.  If you do pre-order it you can claim a 30% discount by using the pre-publication offer code POLLINATOR.

As with my blog, the book is aimed at a very broad audience including the interested public, gardeners, conservationists, and scientists working in the various sub-fields of pollinator and pollination research. The chapter titles are as follows:

Preface and Acknowledgements
1. The importance of pollinators and pollination
2. More than just bees: the diversity of pollinators
3. To be a flower
4. Fidelity and promiscuity in Darwin’s entangled bank
5. The evolution of pollination strategies
6. A matter of time: from daily cycles to climate change
7. Agricultural perspectives
8. Urban environments
9. The significance of gardens
10. Shifting fates of pollinators
11. New bees on the block
12. Managing, restoring and connecting habitats
13. The politics of pollination
14. Studying pollinators and pollination
References
Index


The evolution of insect pollination: a new essay just published

Science MagazineIn the latest issue of the journal Science you’ll find a commentary essay entitled: “The origins of flowering plants and pollinators“, written by Casper van der Kooi and myself.  It’s open access so do go and read it.

This commentary brings together some  recent findings in palaeontology, molecular phylogenetics, and pollinator sensory physiology and behaviour, to discuss the progress that’s been made in understanding the deep-time evolution of this most familiar and charismatic of ecological interactions.

The short version is that the old conceptual models are absolutely wrong.  Some version of “first came the gymnosperms and they were primitive and unsuccessful because they were wind pollinated.  Then, at the start of the Cretaceous, the angiosperms evolved and they were insect pollinated and advanced and so more successful” continues to appear in text books.  But we’ve known for a long time that many of the Jurassic gymnosperms were insect pollinated.  This may (or may not) predate insect pollination of angiosperms: there are huge disagreements between palaeobotanists and molecular phylogeneticists about when the first flowering plants evolved.  The graphic above comes from our essay and shows just how big the discrepancy is: molecular models suggest an origin for the angiosperms about 70 million years prior to the first confirmed fossils.  That’s about equivalent to the whole of the Jurassic period!  There are similar disagreements when it comes to the evolution of pollinating insects: for the Lepidoptera (butterflies and moths) the difference between the earlier molecular and later fossil evidence may be as much as 100 million years.

As we discuss, there are huge implications in these discrepancies for understanding not just how major elements within the Earth’s biodiversity evolved, but also for the origins of pollinator sensory physiology.  Insect behaviours linked to colour vision and odour reception may in turn influence effective crop and wild plant pollination.

The image accompanying our essay is by the very talented biologist, science communicator and graphic designer Elzemiek Zinkstok – follow that link and check out her work.


Biodiversity, plant-pollinator interactions, and the UN’s Sustainable Development Goals

In the past couple of weeks I’ve delivered two presentations at virtual conferences. The first was at a Global Sustainability Summit run by Amity University, one of our partner institutions in India. The second was at the University of Northampton’s own internal research conference. Both of these focused on pollinators, as you might imagine, but they also referred to the United Nations’ Sustainable Development Goals (SDGs). The 17 SDGs are being increasingly used as a framework for promoting the importance of biodiversity to human societies across the globe, and I’m seeing them referred to more and more often in studies and reports about pollinator conservation. That’s great, and I’m all in favour of the SDGs being promoted in this way. However I wanted to highlight a couple of aspects of the SDGs that I think are missing from recent discussions.

The first is that pollinators, and their interactions with plants, are often seen as contributing mainly to those SDGs that are directly related to agriculture and biodiversity. Here’s an example. Last week the European Commission’s Science for Environment Policy released a “Future Brief” report entitled: “Pollinators: importance for nature and human well-being, drivers of decline and the need for monitoring“. It’s a really interesting summary of current threats to pollinator populations, how we can monitor them, and why it’s important. I recommend you follow that link and take a look. However, in the section about relevant, global-level policies, the report highlights “the UN Sustainable Development Goals (SDGs) – especially regarding food security (‘zero hunger’) and biodiversity (‘life on land’).

I think this is under-selling pollinators and pollination, and here’s why. First of all, as we pointed out in our 2011 paper “How many flowering plants are pollinated by animals?”, approaching 90% of terrestrial plants use insects and vertebrates as agents of their reproduction and hence their long-term survival. As we showed in that paper, and a follow up entitled “The macroecology of animal versus wind pollination: ecological factors are more important than historical climate stability“, the proportion of animal-pollinated plants in a community varies predictably with latitude, typically from 40 to 50 % in temperate areas up to 90 to 100% in tropical habitats. Now, flowering plants dominate most terrestrial habitats and form the basis of most terrestrial food chains. So the long-term viability and sustainability of much the Earth’s biodiversity can be linked back, directly or indirectly, to pollinators. That’s even true of coastal marine biomes, which receive a significant input of energy and nutrients from terrestrial habitats.

Biodiversity itself underpins, or directly or indirectly links to, most of the 17 SDGS; those that don’t have an obvious link have been faded out in this graphic:

The underpinning role of biodiversity, and in particular plant-pollinator interactions, on the SDGs needs to be stated more often and with greater emphasis than it is currently.

The second way in which I think that some writers and researchers in this area have misconstrued the SDGs is that they seem to think that it only applies to “developing” countries. But that’s certainly not the way that the UN intended them. ALL countries, everywhere, are (or should be) “developing” and trying to become more sustainable. To quote the UN’s SDG website:

“the 17 Sustainable Development Goals (SDGs)….are an urgent call for action by all countries – developed and developing – in a global partnership.”

and

“the SDGs are a call for action by all countries – poor, rich and middle-income – to promote prosperity while protecting the environment.”

I interpret this as meaning that “developed” countries need to consider their own future development, not that they only have to give a helping hand to “developing” countries (though that’s important too). Just to drive this home, here’s a recent case study by Elizabeth Nicholls, Dave Goulson and others that uses Brighton and Hove to show how small-scale urban food production can contribute to the SDGs. I like this because it goes beyond just considering the agricultural and food-related SDGs, and also because by any measure, Brighton and Hove is a fairly affluent part of England.

I’m going to be talking about all of this and discussing it with the audience during an online Cafe Scientifique on Thursday 25th June – details are here. I’m also going to be exploring more of these ideas in my forthcoming book Pollinators & Pollination: Nature and Society, which is due for publication later this year. The manuscript is submitted and is about to be copy-edited. The PowerPoint slide which heads this post uses a graphic from that book that sums up how I feel about biodiversity, plant-pollinator interactions, and the UN’s Sustainable Development Goals.

One of the reasons why I don’t use reference management software….

….is that it creates nonsense like this! Now, I’m sure that spatial and temporal trends of global pollination have, indeed, benefited me – but that’s not the title of the paper! The actual title is “Spatial and Temporal Trends of Global Pollination Benefit” – full stop. I handled the paper when I was an editor at PLOS One and somehow my role has been bundled into the title by whatever reference management system the authors have used.

I won’t embarrass the authors by saying where it’s from, but it’s yet another example of something that I blogged about a few years ago – that reference management systems encourage sloppy referencing practices.

One thing that “Spatial and Temporal Trends of Global Pollination Benefit Jeff Ollerton” does get right, though, is subject-verb agreement – check out Steve Heard’s post over at Scientist Sees Squirrel on this very topic, and how a careful analysis of sentence structure can improve your writing.

Help to save a bee species from extinction! And watch some cool videos

It’s World Bee Day and what better way to celebrate it than to help a bee species that’s close to extinction – watch this video about Australia’s Green Carpenter Bee and please donate to the cause:

And while you’re at it, here’s another couple of recent bee-related videos to watch:

And here’s one that doesn’t seem to want to embed – it’s Kit Prendergast from Curtin University.

For World Bee Day – an extract from my forthcoming book – UPDATED

Image

UPDATE: turns out the figure I cited for number of bee species is out of date so I’ve corrected it below. Thanks to John Ascher for pointing this out.

Publication of my book Pollinators & Pollination: Nature and Society by Pelagic Publishing has been pushed back until the end of this year or early in 2021. The current pandemic has created problems for the printing and distribution sectors, as it has for so many industries. Therefore, to celebrate World Bee Day, here’s a preview of the bee section from Chapter 2 which is entitled (ironically enough) “More than just bees – the diversity of pollinators”.

2.3 Bees, wasps and sawflies (Hymenoptera)

The bees and their relatives rank only third in terms of overall pollinator diversity.  Within this taxonomic Order, bees are not especially species rich (17,000 or so described species, perhaps 20,000 in total) – over 20,400 (see: https://www.catalogueoflife.org/col/details/database/id/67) compared with the other 50,000 social and solitary wasps, sawflies, and so forth. But what they lack in diversity the bees make up for in importance as pollinators of both wild and agricultural plants, and in their cultural significance.  The general notion of what a bee is, and how it behaves, looks to the honeybee (Apis mellifera) as a model: social, with a hierarchy, a queen, and a large nest (termed a hive for colonies in captivity).  In fact, this view of bee-ness, though long embedded within our psyche, is far removed from the biology of the average bee: most of them have no social structure at all, and a fair proportion of those are parasitic.  In Britain we have about 270 species of bees, give or take (Falk 2015) though there have been extinctions and additions to this fauna (see Chapters 10 and 11).  These species provide a reasonable sample of the different lifestyles adopted by bees globally.  They can be divided into four broad groups.

Honeybees include several highly social species and subspecies of Apis, of which the ubiquitous western honeybee (A. mellifera) is the most familiar.  Most colonies are found in managed hives, though persistent feral colonies can be found in hollow trees, wall cavities, and other suitable spaces.  They are widely introduced into parts of the world where they are not native (e.g. the Americas, Australia, New Zealand) and there is some debate as to whether they are truly native to Britain and northern Europe, with supporting evidence and arguments on both sides.  Colonies can be enormous and contain thousands of individuals, mostly female workers, with a single queen.  Unmated queens and males (drones) are produced by the colony later in the season.

Bumblebees (Bombus spp.) are typically also social, though their nests are much smaller (tens to hundreds of individuals).  Depending upon the species these nests can be in long grass, rodent holes, or cavities in buildings and trees.  Twenty-seven of the more than 250 species have been recorded in the UK, but six of these are not strictly social; they are parasitic and belong to the subgenus Psithyrus which will be described below.

The so-called solitary bees are by far the largest group in Britain (about 170 species) and worldwide (more than 90% of all species).  In the UK they belong to 15 genera, including Andrena, Anthophora, Osmia, Megachile, etc.  The females of most of these bees, once they have mated, construct nests that they alone provision with pollen for their developing young.  Nesting sites can be genus- or species-specific, and include soil, cavities in stone or wood, and snail shells.  Some species are not strictly solitary at all and may produce colonies with varying levels of social structure, though without a queen or a strict caste system; we term them “primitively eusocial”.  In fact sociality has evolved and been lost numerous times in the bees and in the rest of the Hymenoptera (Danforth 2002, Hughes et al. 2008, Danforth et al. 2019).  It’s also been lost in some groups that have reverted back to a solitary lifestyle, and even within a single genus it can vary; for example in the carpenter bee genus Ceratina (Apidae: Xylocopinae) tropical species are more often social than temperate species (Groom & Rehan 2018).

The final group is termed the cuckoo bees and, like their avian namesake, they parasitise the nests of both social and solitary bees (though never, interestingly, honeybees).  There are about 70 species in 7 genera, including the bumblebee subgenus, Psithyrus.  Other genera include Melecta, Nomada and Sphecodes.  In some cases the parasitic species are closely related evolutionarily to their hosts and may resemble them, for example some Psithyrus species.  In other cases they may be only distantly related and in fact look more like wasps, e.g. Nomada species.  Some genera of cuckoo bees are restricted to parasitising only a single genus of bees, others are parasites of a range of genera (Figure 2.4).

Although we often think of bees, overall, as being the most important pollinators, in fact species vary hugely in their importance.  Pollinating ability depends upon factors such as abundance, hairiness, behaviour, body size, and visitation rate to flowers (Figure 2.1).  Size is especially important for three reasons.  First of all, larger animals can pick up more pollen on their bodies, all other things being equal.  Secondly, in order to bridge the gap between picking up pollen and depositing it, flower visitors must be at least as large as the distance between anthers and stigma, unless they visit the stigma for other reasons.  Finally, larger bee species tend to forage over longer distances on average (Greenleaf et al. 2007) thus increasing the movement of pollen between plants.  However, most of the world’s bees are relatively small as we can see from the analysis of British bees in Figure 2.5.  Many species have a maximum forewing length of only 4 or 5 mm, and the majority of species are smaller than honeybees.  Remember also that these are maximum sizes measured from a sample; individual bees can vary a lot within populations and even (in the case of Bombus spp.) within nests (Goulson et al. 2002).  So the assumption that all bees are good pollinators needs to be tempered by an acknowledgement that some are much better than others.    


Figure 2.5: The sizes of British bees. Forewing length is a good measure of overall body size and the data are maximum lengths recorded for species, except for the social bumblebees and honeybee I have used maximum size of workers (queens are often much larger). The blue line indicates the honeybee (Apis mellifera). The biggest bee in this data set is the Violet Carpenter Bee (Xylocopa violacea) which, whilst not generally considered a native species (yet), has bred in Britain in the past. Data taken from Falk (2015).

A pollinator to watch out for in your gardens: the Red-girdled Mining Bee – UPDATED

Last week, during one of my lockdown garden pollinator surveys, I spotted a bee visiting Germander Speedwell (Veronica chamaedrys) in the garden that I didn’t recognise. It initially confused me as it looked superficially like a Blood Bee in the genus Sphecodes. However the bee was clearly collecting pollen, which Sphecodes spp., being cleptoparasites, don’t do. A quick check in Steven Falk’s Field Guide to the Bees of Great Britain and Ireland and a look at Steven’s Flickr site, suggested that it was almost certainly the Red-girdled Mining Bee (Andrena labiata), which is frequently associated with Germander Speedwell.

I posted this video on Twitter and Steven kindly confirmed my identification:

The Red-girdled Mining Bee is considered “Nationally Scarce” and it has a scattered and southerly distribution, as you can see from the map above, which is from the National Biodiversity Network Atlas account for the species. It’s only recorded from about half a dozen sites in Northamptonshire according to Ryan Clark, the County Bee Recorder. However Steven tells me that it’s being seen more and more frequently in gardens, and indeed just the other day Sarah Arnold, who is also carrying out surveys, emailed me to say that she had spotted it in her garden in Kent.

So this is a bee that’s definitely one to look out for, especially if you have Germander Speedwell growing.

UPDATE: I should of course have also given a link to the BWARS account for this species, and mentioned that confirmed or suspected observations can be uploaded to iRecord.

Garden plant-pollinator surveys: progress so far

The network of pollination ecologists and insect specialists who have confirmed that they are surveying plant-pollinator networks in their gardens now stands at 50. As the map above shows, most are in the UK, Ireland and mainland Europe, but the Americas are also becoming well represented, we have a couple of people surveying in North Africa, and three in Australia. An x-y plot of the coordinates of the gardens shows the spread a little better:

Some people have started to send me data already, which is great; if you’re surveying and haven’t let me know your latitude and longitude, please do so, preferably decimalised – you can convert degrees/minutes/seconds to decimal here: https://www.latlong.net/degrees-minutes-seconds-to-decimal-degrees

I’ve managed 13 formal 15 minute surveys so far, plus have a few ad hoc observations that I am keeping separate, and I will be continuing my data collection for the foreseeable future. I’ve started playing with the data as you can see below. This is a plot made using the bipartite package in R, with plants to the left and pollinators to the right. The size of the bars is proportional to the number of pollinators/plants a taxon connects to. In the plants you can immediately see the dominance of apple (Malus domestica) and greengage (Prunus domestica), which attract a wide variety of insects to their flowers. Of the pollinators, the hairy-footed flower bee (Anthophora plumipes) and dark-edged beefly (Bombylius major) are especially common and generalist in their flower visits. It will be really interesting to see how this changes over the season, and how our fruit and vegetables are connected into the wider network via pollinators that they share with the ornamental and native plants.

If you are experienced at surveying pollinators and want to get involved, follow that first link and check out the protocol and FAQs, and please do email me: jeff.ollerton [at] northampton.ac.uk