Since beginning this blog in 2012 I’ve traditionally posted one or two Christmas-themed items around this time of year, including a piece on “Thanking the pollinators for Christmas” and a true story from 2013, “A Christmas vignette“. The role of pollinators in producing much of the traditional Christmas fare has subsequently been picked up by others (last year the University of Bristol, this year a blog from Trinity College Dublin) so I’ve decided to break with tradition and consider the ways in which biodiversity (both wild and farmed, though the latter of course originated as the former) adds to the cultural experience of Christmas through its traditions and rituals.
In this regard I’m coming at the topic as a north-European agnostic who values Christmas as an opportunity to relax and unwind at the darkest, coldest* part of the year, rather than as a Christian. And because I’m a British scientist much of what I say relates to British customs, though I’ve tried to include non-British examples where I’m aware of them – feel free to let me know about examples I’ve missed by commenting below.
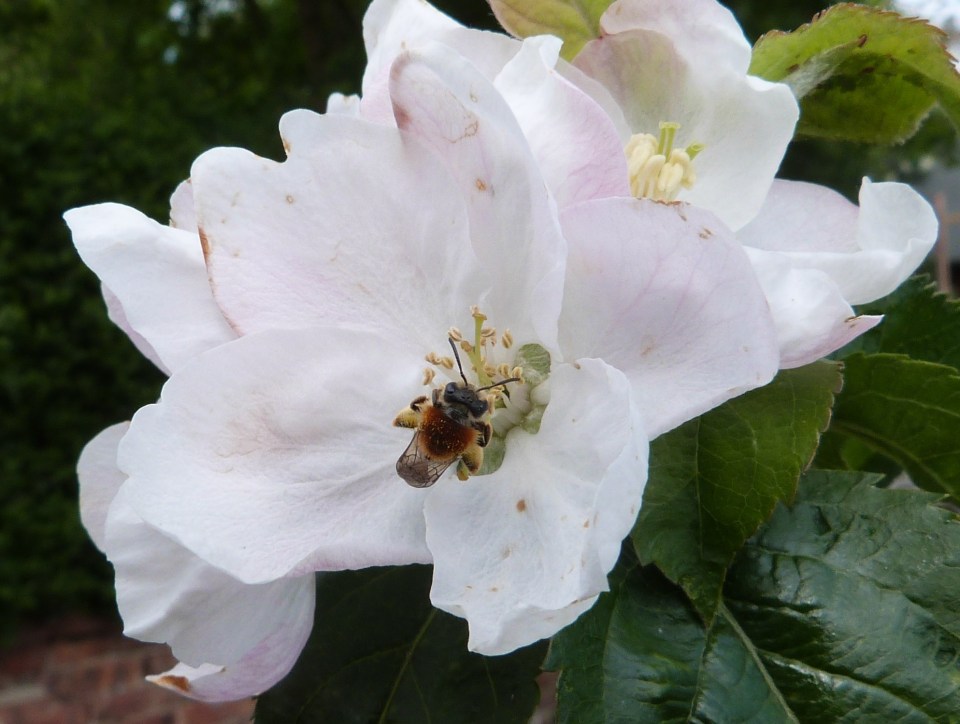
I’ve decided to structure this post taxonomically and focus on a Six Kingdom Classification** of life on Earth as that’s been the theme of my first year undergraduate teaching since October. Four of the six Kingdoms can be dealt with fairly quickly as their significance to Christmas is marginal or non-existent. The two “bacterial” Kingdoms (Archaea and Eubacteria) contribute little to Christmas other than providing much of the gut flora that’s going to help us digest our Christmas dinner. Important but not specifically festive. Likewise the protists and algae (Kingdom Protoctista) add nothing specific to Christmas unless there are traditions associated with seaweed of which I am unaware.
The other three Kingdoms are the ones where cultural biodiversity associations are more apparent. The Kingdom Fungi (yeasts, mushrooms and moulds) provides us with several Christmas traditions including (in Germany) hanging mushrooms on the Christmas tree for good luck, and in parts of Scandinavia hanging strings of dried mushrooms around the house as decorations and as a source of winter food. There is also the association between the red-and-white colour scheme of fly agaric magic mushrooms (Amanita muscaria) and the robes of Santa Claus, though I’ve seen that idea debunked in a few places and it appears that the “traditional” interpretation of Santa’s suit originated in the USA in the 19th century.
The Kingdom Animalia (both invertebrates and vertebrates) affords us a host of cultural connections to Christmas. Birds include the turkey (Meleagris gallopavo) which in times past were famously walked to London from Norfolk; the domestic goose (Anser anser domesticus); and much of the song Twelve Days of Christmas refers to birds, including the turtle dove (Streptopelia turtur) one of the UK’s most declining and threatened bird species. Mammals we associate with Christmas include of course reindeer (Rangifer tarandus) pulling Santa’s sleigh, led by the nasally-advantaged Rudolph, but also domesticated farm animals. For example in Denmark in osme households it’s more traditional to eat pork (Sus scrofa domesticus) for Christmas dinner than goose.
Staying with the vertebrates, in our house it’s traditional to have smoked salmon (Salmo salar) with scrambled eggs for breakfast on Christmas Day, and (again in Denmark) sild (Clupea harengus) is also traditionally served as a starter, but I don’t know of other fish traditions. Likewise I’m unaware of any invertebrates that are specifically associated with Christmas, though there have been recent reports of sustainably-sourced lobsters (Homarus americanus and H. gammarus) becoming “traditional” in Europe. There are also some local traditions such as honey bees singing in their hives on Christmas Eve.
The last of the Six Kingdoms is the Plantae, which, whilst the least taxonomically diverse, provides us with a wealth of cultural associations to Christmas. These traditionally include evergreen plants that have been used to decorate homes, probably since the earliest pagan Yuletide festivals, such as: Christmas trees (various conifers in the genera Picea, Abies and Pinus); European ivy (Hedera helix); holly (Ilex aquifolium); and mistletoe (Viscum album). However such traditions evolve and adapt to local needs and availability of plants. For example in North and South America other genera of conifers not found in europe, such as Pseudotsuga and Araucaria, may be used as Christmas trees***. Likewise the absence of European mistletoe in North America means that people have adopted native mistletoes in the related genus Phoradendron for decorating and snogging traditions. Over at her blog, ecologist Manu Saunders has recently discussed how native Australian species can substitute European plants for Christmas decorations.
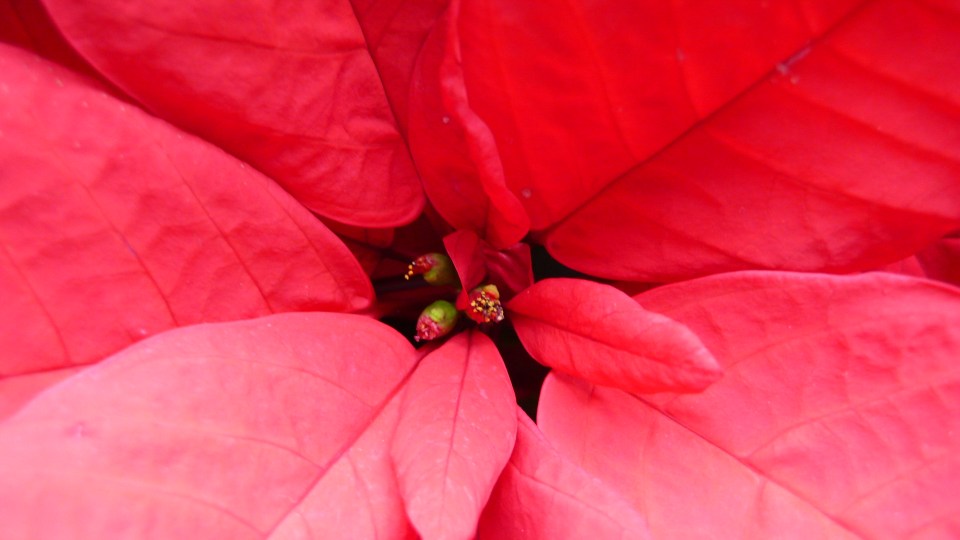
The final example from the Plantae is the poinsettia (Euphorbia pulcherrima) which I’ve pictured above. In many ways this is an unusual plant to have such a strong cultural association with Christmas: it’s a mildly toxic species of spurge from tropical Mexico that was introduced to North America in the 19th century, then subsequently to Europe. However its festive connotations date back to the earliest period of Spanish colonisation in the 16th century, so it’s older than some of the other Christmasy traditions I’ve discussed.
Of course biodiversity is about more than just species and taxonomic diversity, it also encompasses the diversity of habitats in which that life is found. Here too we see strong influences of the natural world on the culture of Christmas, including festive scenes of snow-bound boreal conifer forest. As our planet warms, however, that might be a view that is found only on Christmas cards and old movies, rather than directly experienced*.
And on that sobering note, I wish all of my readers and restful and biodiverse holiday: have a great Christmas everyone!
*Ha! It’s looking to be the warmest December on record, and at times has felt more like early summer than mid-winter.
**I’m aware that there are other Kingdom-level classifications out there which could be used, but the Six Kingdom approach is a good starting point.
***Closer to home, colleagues in the office adjacent to mine have adorned their large weeping fig (Ficus benjamina) with home-made Christmas decorations. Looks good.


 It is a general ecological rule that no species exists in isolation; all species interact with other organisms within the communities to which they belong. The collection and analysis of ecological interaction data has burgeoned over the past couple of decades, particularly in my own area of (largely) mutualistic species interactions such as plant-pollinator relationships – see for example this

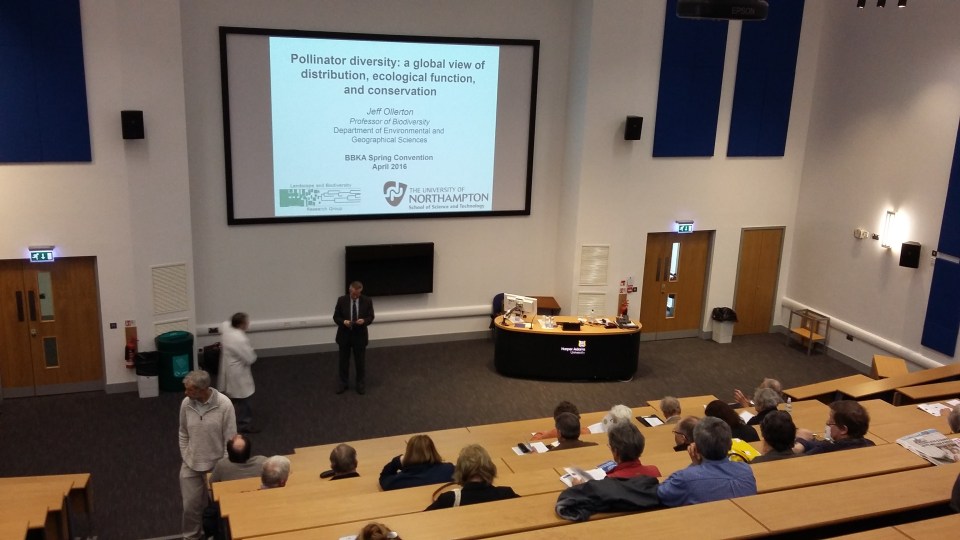 As I write this I’m painfully conscious that (a) it’s a couple of weeks since I last posted on the blog; and (b) I have a long list of things to complete before I head off to Tenerife for ten days of field work on Friday. The absence of posting has been due to my current work load, including the number of conferences, talks and workshops I’ve been involved with in the past month, which seems to have taken up a disproportionate amount of my time. It’s all been interesting and useful, however, and reflects the rising activity stemming from the