Category Archives: Pollination

The state of bees: the European Red List has been published

P1010430

As I’ve frequently reported on this blog, there is growing global concern about declines in pollinator diversity and abundance across many regions, and much research is going on into what is causing those declines, their scale and consequences, and what can be done to reverse pollinator loss. It’s therefore great to see the publication of the European Red List of Bees which provides information on the conservation status of the c. 2000 species of bees in Europe.

The report uses standard IUCN criteria for assessing each species and has been picked up by various media and NGOs, who have typically promoted it with claims such as “Nearly one in 10 of Europe’s wild bee species face extinction“.  However the reality of what the report has found is much more complex and nuanced than the headlines suggest.  Over half of the bee species were classified as Data Deficient, meaning that we don’t have enough information to assess whether they are threatened or not.  Of those that could be classified, 7 species are Critically Endangered, including 3 that are endemic to Europe and found nowhere else in the world; 46 are Endangered including 12 endemics; 24 are Vulnerable, with 7 endemic; 101 are Near Threatened with 17 endemic; 663 are Least Concern (68 endemic), meaning that there are no immediate threats to their survival.

If we turn the “1 in 10” headline around, then a more accurate statement would be “Over 90% of Europe’s bees (for which we have sufficient data) are not immediately threatened by extinction”.  Of course that could change once data for the poorly studied species becomes available.  These are not grounds for complacency; but neither are they grounds for panic.

The scale at which we assess biodiversity is critical if we are to fully understand the threats to species, and when and where limited funds can be prioritised for conservation actions.  Species that are locally endangered or even extinct may actually be quite common when assessed across the whole of their distributional range.  For this reason it’s important to consider the status of species in as wide a geographic region as is possible.  Preferably this would mean a global assessment; but for most species we simply don’t have enough information to be able to undertake such a study, particularly for developing countries where there are limited historical records of species occurrences on which to draw.  Even in a relatively developed region such as Europe, with a long history of natural history observation and monitoring, there are huge gaps in our knowledge – in this case for more than half of Europe’s bees.

With this in mind I looked at the European status of those bee species which are now extinct in the UK, as I discussed in December.  Two of the extinct species are considered Critical (Bombus cullumanus and Andrena tridentata); two are Near Threatened (Dufourea minuta and D. halictula); seven other species are Least Concern; and the remaining two (Andrena lepida and A. lathyri) are Data Deficient.  Clearly some of the UK extinct species are in trouble across Europe, but others are not and may re-colonise the UK in the future, as we believe may have happened in the last couple of years for Andrena vaga.  Or they could be helped to re-colonise via a reintroduction programme, as has been done for Bombus subterraneus

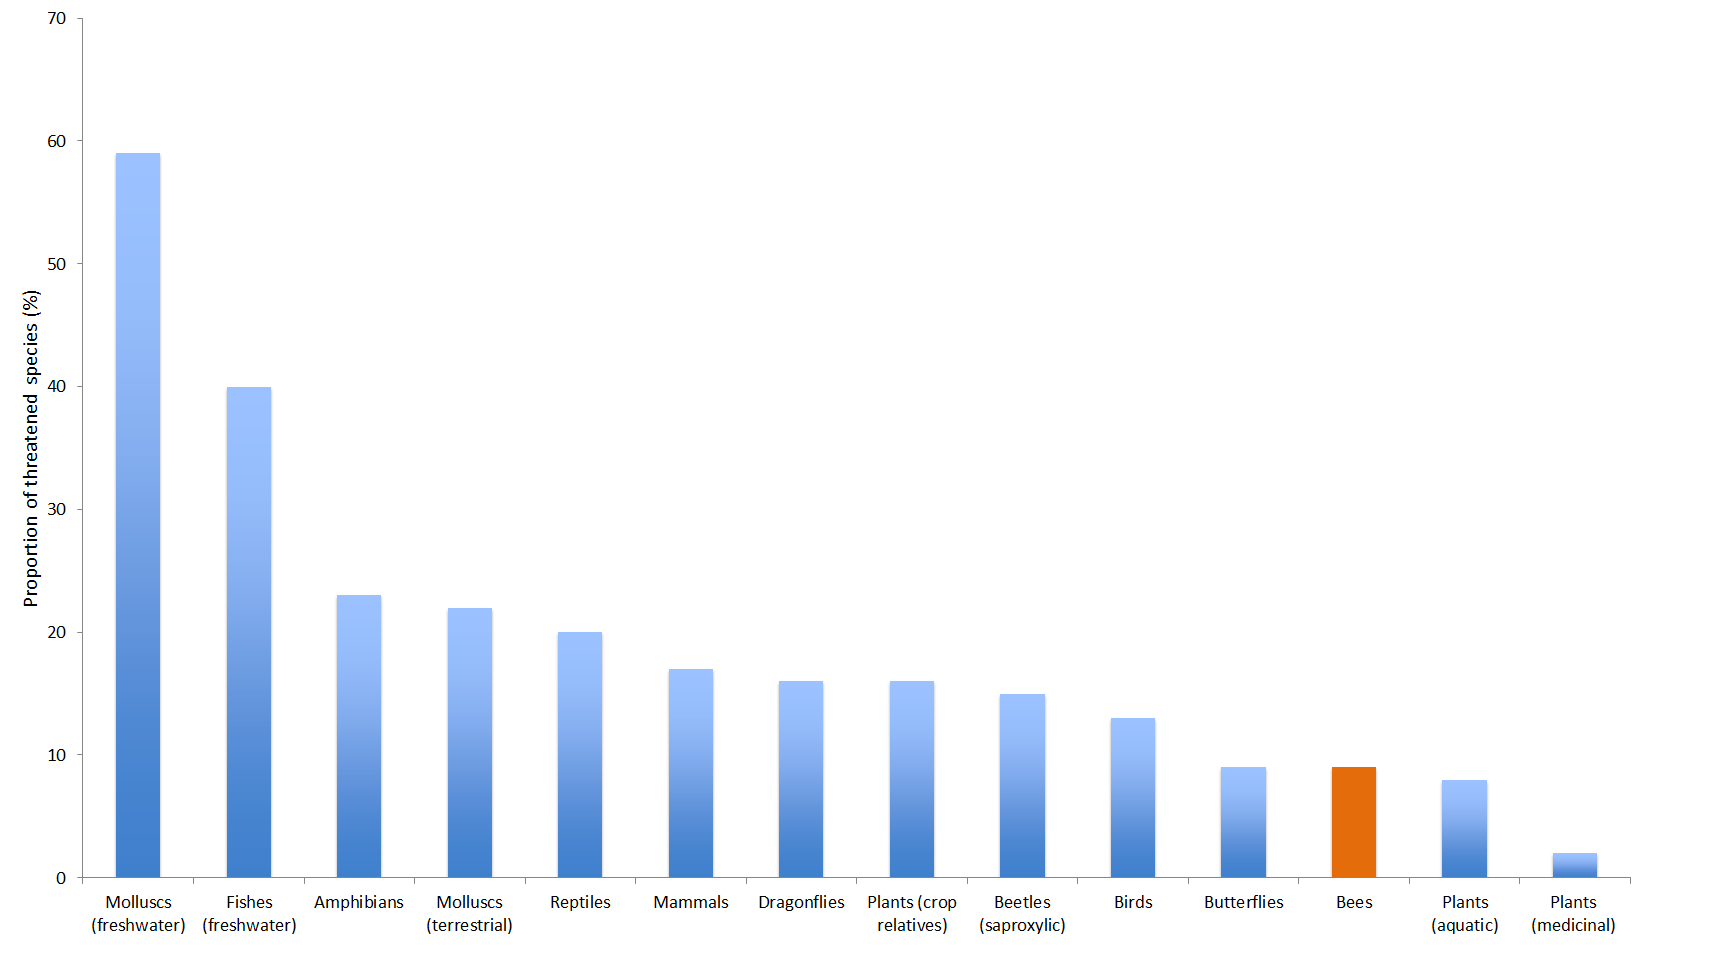
Another way in which to put the findings of this report into a wider context is to consider how the level of threat to bees compares with that of other groups of species.  The authors helpfully provide some comparative data in the summary, which I’ve graphed below (click on it for a better view):

IUCN stats

Overall the proportion of threatened bees is identical to that of butterflies, perhaps because they require some similar resources (flowers on which to feed) and tend to be found in broadly similar habitats.  But other taxa are at much greater risk, particularly freshwater fish and molluscs: yet these taxa have not received the same level of publicity about their plight.  Their are no “Save the Mussels” campaigns, or television series about endangered fish in rivers and lakes.  This is surprising: clearly bees have grabbed the public’s attention because of the role they play in crop pollination, but freshwater fish are also suppliers of ecosystem services either directly (fishing) or indirectly (playing a role in maintaining the “health” of these ecosystems, as do the molluscs). Perhaps more importantly for these species, they are also indicators of water quality, an aspect of natural capital that concerns us all.

The authors of the European Red List of Bees are to be congratulated on a fine piece of work that makes a major contribution to our understanding of pollinator conservation, and is timely, coming soon after the publication of the National Pollinator Strategy for England.  However there’s still a lot of work to do to fill in the gaps for species that are Data Deficient and to understand the more detailed population trends, which are unknown for almost 80% of the bee species.

One of the most surprising findings, though, is that the honey bee (Apis mellifera), the most intensively researched pollinating insect on the planet, is considered Data Deficient “until further research enables us to differentiate between wild and non-wild colonies in order to determine the conservation status of the species in the wild.”  That’s an interesting state of affairs!

Full citation:

Nieto, A., Roberts, S.P.M., Kemp, J., Rasmont, P., Kuhlmann, M., García Criado, M., Biesmeijer, J.C., Bogusch, P., Dathe, H.H., De la Rúa, P., De Meulemeester, T., Dehon, M., Dewulf, A., Ortiz-Sánchez, F.J., Lhomme, P., Pauly, A., Potts, S.G., Praz, C., Quaranta, M., Radchenko, V.G., Scheuchl, E., Smit, J., Straka, J., Terzo, M., Tomozii, B., Window, J. and Michez, D. 2014. European Red List of bees. Luxembourg: Publication Office of the European Union.

What Einstein didn’t say about bees – UPDATE – May 2021

https://i0.wp.com/www.impawards.com/intl/misc/2012/thumbs/sq_more_than_honey.jpg

It’s more than 6 years (!) since I wrote this post. Over that period I’ve been asked many times about the Einstein bee quote and I’ve always replied that it’s made up, and that further more, Einstein was a physicist: he had no interest in bees!

Turns out, that’s not quite correct. There’s still no evidence that Einstein stated the infamous bee quote; however he does seem to have had an interest in bees. A newly-discovered letter from the great man mentions his admiration of the work of Karl von Frisch, whose research on the honey bee ‘waggle dance’ earned him a Nobel Prize. There’s a couple of news stories online about this: here’s one from Cosmos, and another from The Conversation. The original paper discussing the letter, by Adrian Dyer and colleagues, can be viewed here.

So I will have to moderate my response in the future, but it doesn’t change the big picture: Einstein never said it!

———————————————————————————————————————–

In the 100th anniversary year since Albert Einstein published the paper on his General Theory of Relativity, it’s saddening to think that one of the things that he will be best remembered for is something he did not say.  There are various versions of it, but they all amount to the same thing:

“If the bee disappeared off the surface of the globe, then man would have only four years of life left. No more bees, no more pollination, no more plants, no more animals, no more man.”

This statement could be dissected and disproved in numerous ways:  for example, there’s over 20,000 species of bees, so what is “the bee”?  Plus most of our crops are not bee (or even insect) pollinated, they are wind pollinated grasses such as wheat and rice.  Etc. etc.

But what is particularly annoying about it is – EINSTEIN NEVER SAID IT!  As far as anyone is aware he had no interest in bees whatsoever and the original source was a Canadian beekeepers’ journal in the 1940s.

It’s even more annoying that, despite the fact that we’ve known the statement is both factually incorrect and not by the great man, documentary film makers and journalists are STILL using it to support their work.  The latest example I’ve seen is this documentary, the poster of which is shown above.

Rant over: back to reading paperwork for a meeting this afternoon.

UPDATE:  I’d forgotten that Tom Breeze at University of Reading posted a fuller account of Einstein’s (non) quote last year – here’s the link.

Something for the weekend #1

Two of my favourite blogs, Dynamic Ecology and Small Pond Science, both produce end-of-week compilations of links to interesting items on the web.  On the basis that plagiarism imitation is the sincerest form of flattery, I thought I’d follow suit with a regular series of posts to biodiversity-related* items that have caught my attention during the week**.  This is the first one.


  • In an article in the Times Higher, John Warren and colleagues discuss their concern about the decline in graduates with species identification skills.  They raise some valid points that echo worries that others have raised in the past, but I question their assertion that “each year there are fewer than 10 UK graduates who are proficient enough in field identification skills to be employable”.  I’d like to see some evidence to back that up.
  • Mr Spock has died; I’ve always loved Star Trek and Leonard Nimoy’s passing is sad news.  But he lived long, and he prospered, and we can’t ask more from life than that.
  • Tropical deforestation may have actually accelerated, not decreased, according to a new study.  But Brazil is faring better than other countries.
*Disclaimer: may sometimes contain non-biodiversity-related links.
**Feel free to recommend links that have caught your eye.

Evolving a naturalist – happy birthday to me!

Jeff in the tee-pee

Somehow, today is my 50th birthday.  So I thought I’d mark it with a short post about my personal evolution as a naturalist and, ultimately, professional scientist.

One of the great things about the internet and social media such as Facebook is that you can make exciting discoveries on a weekly basis.  Recently I found out something that means a lot to me on a very personal level: I discovered that a family* who lived in the same street when I was growing up in Sunderland in the 60s and 70s have digitised some old home movies and made them available on YouTube.  In our digital age in which every phone and camera can capture and share events as they happen, it’s sometimes easy to forget that owning a movie camera in the 60s was quite a rarity and the majority of kids living at that time were never filmed.   

These movies are exciting not just because one of them shows me aged about 5 years (in the blue shirt) playing with friends (I’m there from 3’53”) but because it documents, in colour and moving pictures, one of the reasons why I became a professional naturalist with a deep fascination for biodiversity. 

The grassland in which we are erecting a tee-pee is not some country meadow, the kind of wild rural landscape cited by so many other naturalists as inspiring their childhood fascination with natural history.  These grasslands had arisen spontaneously on cleared demolition sites, following the removal of Victorian terraced housing and tenement blocks, some of which were slums and others that had suffered bomb damage in the Second World War (now that does make me sound old!)

Up until the 1950s this area had been very built up, with the houses, shops and pubs serving the local families who were employed mainly in the shipyards and coal mines to the north of the town.  You can get a sense of how urban it was from this 1898 map of Southwick; the places I refer to are just south-west of The Green to the left of the map. 

Following demolition the sites were left to their own ends, and were colonised by plants, insects, birds and mammals from patches of habitat closer to the river that had either been cleared of buildings earlier in the century, or which had never been built upon at all.  There are some nice areas of magnesian limestone grassland nearby along the higher banks of the River Wear valley, and typical calcicole plants such as Greater Knapweed (Centaurea scabiosa) could be found on these post-demolition grasslands.  In fact, in the absence of horse chestnut trees, we used to play a version of conkers using the unripe seed heads of Greater Knapweed.  Was that an echo of earlier children’s games in Britain, prior to the introduction of horse chestnuts in the 17th century?  Apparently similar games were played with snail shells and hazelnuts.  

If you watch the opening minute of this piece of footage from the same series, and ignore the girls posing and playing in the foreground, the background reveals a rich flora of plants, with butterflies hopping between flowers.  The first bird species that I can remember identifying, and being fascinated by its bright colours, was Goldfinch (Carduelis carduelis) feeding on the seeds of tall thistles in the very area where this was filmed.   The first butterfly that I could put a name to was the Small Tortoiseshell (Aglais urticae), also feeding on thistles, but this time on the nectar-rich flower heads, as a pollinator.  We’d collect its caterpillars from the nearby nettles and raise them in jars.

So you don’t have to have had a rural upbringing to appreciate and benefit from nature, and to later influence your profession and passions, any piece of land can inspire interest in kids, regardless of its origin, if nature is left to colonise. Unmanaged, semi-wild green space within towns and cities has huge value, both for wildlife and for the culture of childhood.  They need to be protected just as much as rural nature reserves, including the generally disparaged but actually biodiverse “brownfield” sites, as Sarah Arnold has discussed in a recent blog post.

Some of the riverside grasslands still remain and I hope that they are fascinating new generations of kids with their colour and diversity and flouncing butterflies. But the post-industrial grasslands on which I played and looked for bugs and flowers are all gone; they were cleared and built upon in a flurry of housing and retail development in the 1980s.  Perhaps in the future they may return if those buildings are themselves demolished and the land allowed to lie undisturbed for a while.  That is what nature does: it ebbs and flows across our landscapes in response to human, and natural, interventions, endlessly changing and endlessly fascinating to the curious minds of children and scientists, no matter how old they are.


*My sincere thanks to the Scrafton family who took the original footage, made it available on YouTube, and gave me permission to use it in this post.

Data I’ll never publish 1: flower production and plant size in Lotus corniculatus

Lotus flower production graph 1991

For reasons that will become obvious next week, I’ve been in a reflective mood recently and this first in an occasional series of posts about “data I will never publish” is one of the results of that reflection.

When scientists have been doing research for a few years, most of them start accumulating a back-log of data.  In some cases this is data that may be published in the future (for ecologists that means long-term data sets, which I’ve talked about before) but other data may be fragmentary or simply too limited to be publishable.  Good data are hard won and I never, ever discard data: you never know when it may come in useful.  So in this series I will present such scraps of data that I know I’ll (probably) never publish.  Their purpose is to illustrate interesting points, to stimulate discussion and ideas, and hopefully they might even be of use to other researchers in one way or another (I’m happy to share the raw data, just drop me a line).

This first data set was collected in the grasslands of Wytham Woods in 1991 when I was a research student.  It subsequently ended up being used in my PhD thesis and in one of the papers that resulted from it (Ollerton & Lack 1998) but not quite in this form, rather embedded within larger analyses.  The graph above (click on it for a more detailed view) shows the relationship between individual plant size (measured using a calibrated non-destructive biomass index that I developed) and total flower production for that year, in the plant species Lotus corniculatus (Fabaceae), commonly known as bird’s-foot trefoil.

This plant is a herbaceous perennial grassland species which can live for quite a long time (at least 50 years).   The data show that plant size and flower production can span 5 orders of magnitude – the maximum number of flowers produced in one year by a single plant in this population was over 13,000, which is astonishing for a low-growing grassland species!

I’ve used this figure in undergraduate lectures as it illustrates several important points about many plants:

  • in theory, there is no upper limit to the potential maximum size of plants.  As long as they have appropriate growing conditions and are not limited by weather or disease or herbivory, they will continue growing.  That’s because they are modular, constructed of iterations of basic units of the plant “body”, and show indeterminate growth.
  • likewise, there is no upper limit to the number of flowers that can be produced because each modular unit can itself produce one or more flowers.
  • plants can be very plastic in their response to the environment.  The data form two clusters; the lower one (smaller plants) is from a sub-population that grew in a grassland that had never been fertilised.  The upper cluster (larger plants) grew in an adjacent area that had previously been an arable field and in which there were still fertiliser residues present in the soil.  The smaller plants are likely to have been older than the larger plants, but the latter had more soil nutrients on which to draw.

The following graph illustrates the same plants but this time it’s the relationship between biomass and number of seed pods produced.  Still a linear relationship with no sign of a plateau; female reproduction in these plants just goes on and on (as, of course, does male function via pollen dispersal.

Lotus seed pod production graph 1991

This is one of the things that I love about plants: they are so flexible in their response to growing conditions!

Did you remember to thank the insects for Christmas?

2013-12-23 11.44.27

This year I decided not to re-post my traditional “Thank the insects for Christmas” piece, in part because I don’t want to bore the good readers of this blog with too much repetition, but also because the idea has been taken up by the Urban Pollinators Project at the University of Bristol, and developed into an infographic (on which I advised) that you can view here.  The BBC News Website used the information for a nice article called “The insects that made Christmas“.  So look back on your Christmas dinner, if you had one, and give thanks to the many invertebrates that made it happen!

The other reason for not doing a full re-post of that piece is that I was feeling worn out by a long university term that ended not with a whimper, but a stressful double-bang of publication of our pollinator extinctions paper (and the associated media interest, which I may talk about early in 2015) and the release of the results of the Research Excellence Framework, which I coordinated for my department.  We were pleased with the outcome, with over 40% of our research papers rated as “world leading” or “internationally excellent”, and most of the rest being “recognised internationally”.  For a young, mainly teaching-focused, non research-intensive institution such as the University of Northampton (which doesn’t enjoy the facilities and funding of older, larger universities), that’s an impressive result.

A final bit of news is that this blog made it onto the MySciBlog survey 2014, by Paige Brown Jarreau (Louisiana State University) who asked more than 600 science bloggers “to list up to the top three science blogs, other than their own, that they read on a regular basis”.  The initial results can be found at Figshare, and I’ve inserted network graphic below (click on it for a larger view).  The size of a node is proportional to the number of respondents who read that blog regularly and my blog is part of the green section near the top, tucked just under the dominant Dynamic Ecology.  It’s gratifying to know that other bloggers are reading this in significant numbers!

Thanks to everyone who has read my blog over the past year, particularly those who have commented on the ideas and information I’ve presented: best wishes to you all for 2015!

BlogsRead_ModularityClass3_InDegreeSize copy

Extinction of British bees and flower-visiting wasps – a new assessment of rates and causes

Extinction of species is perhaps the most fundamental assault that we as humans can inflict on the rest of the natural world.  Extinctions take a range of forms, from the loss of a whole species (such as the sad case of the St Helena Giant Earwig, recently declared extinct by the IUCN), down to extirpation of local populations.

For an island nation such as Britain, extinctions at a country level are highly significant because there is limited opportunity for species to disperse across the sea and re-colonise areas where they previously lived.  In a new research paper published this week in the journal Science we have addressed the subject of pollinator declines in the UK and asked the following questions:

1.  How many bee and flower-visiting wasp species have gone extinct in the UK?

2.  Is the rate of extinction (e.g. number of species per decade) constant or variable over time?

3.  Can we interpret any patterns in relation to broader societal changes, for example in agricultural policy, conservation strategies, etc?

The research is a collaboration between myself and University of Northampton colleagues Dr Robin Crockett and Dr Hilary Erenler, together with Mike Edwards from the Bees, Wasps & Ants Recording Society (BWARS), the c. 500,000 records of which were used in these analyses.  This is probably the most extensive data set on these insects available for any country and an important resource.

The answer to the first question is that 23 species of bees and flower-visiting wasps have gone extinct, ranging in time from the crabronid wasp Lestica clypeata (last observed in 1853) to the solitary bee Andrena lathyri (not seen since 1990).  All of these species still occur on mainland Europe, so these were country-level extinctions, not species extinctions.

The answer to questions 2 and 3 is that the rate of extinction is highly variable, and by using a novel statistical approach adapted by Robin to analyse the changing rate over time, we found that the main period of species loss followed changes to agricultural policy and practice just after the First World War.  This is much earlier than previously believed: until now it has usually been the Second World War and the subsequent Common Agricultural Policy which have been seen as the main drivers of pollinator loss.  This figure produced by Robin shows the results in detail:

Figure 2 colour

The four periods marked in red are the points where we estimate the rate of extinction changed (with 99% confidence intervals shown in pink).  The most rapid rate of extinction (shown by the solid blue piecewise regression lines and dashed 99% confidence intervals) is from the late 1920s to the late 1950s.  This, we believe, is the cumulative effect of agricultural changes precipitated and then augmented by the First and the Second World Wars, respectively.

The period of extinction from the late 19th into the early 20th centuries was probably caused by increased import of South American guano as soil fertilizer which increased grass productivity at the expense of wild flower diversity.  This reduced reliance on strict rotational cropping, including fallow periods with nectar- and pollen-rich weeds, and N-fixing legume years.  However it was the invention of the Haber Process in 1909, allowing industrial manufacture of inorganic nitrogen fertilizers for the first time, that fundamentally affected British agriculture.

The slow down of the rate of extinction from the early 1960s to the mid 1980s is not easily explained given the continued intensification of farming, encouraged by Common Agricultural Policy subsidies.  It could be due to the most sensitive species having been already lost, or because of conservation initiatives including the establishment of more nature reserves by organisations such as the Wildlife Trusts and the RSPB, habitat restoration and management by groups such as the British Trust for Conservation Volunteers, more farmers going organic, etc.  Or it could be a combination of both, and/or factors we’ve not yet thought of.

The final period of extinctions from 1986 to 1994, where the rate seems to increase, could be seen as evidence against the slowing in the rate of decline of pollinators in north west Europe found by Carvalheiro et al. (2013).  However  we need to be cautious here as there’s a large confidence interval around the calculated extinction rate.  The four extinctions between 1988-1990 could be an isolated cluster, or the start of a further period of relatively high extinction rate.  Only time will tell!

Bees, wasps and other pollinating insects are absolutely vital to the functioning of our natural ecosystems and for a great many agricultural crops.  We’ve known for some time that these insects are declining in Britain but now we can see how historical agricultural changes have caused species to become extinct. The big question is whether these extinctions have stopped or whether they will continue in the future. The species that have been lost to Britain still survive on the Continent and there is the possibility of natural re-colonisation or artificial reintroduction, both of which have occurred in recent years.  However in order for this to be successful we must restore as much natural habitat as possible within our farmland, which after all covers some 70% of the British land surface.  The irony of our findings, of course, is that pollinators are vital for agriculture, as the UK Government’s National Pollinator Strategy recognises.

Studies such as this illustrates the importance of maintaining the year-on-year effort of recording natural history data – the research simply wouldn’t have been possible without the BWARS records, which are mainly collected by amateur naturalists.

The full citation for the paper is:  Ollerton, J., Erenler, H., Edwards, M. & Crockett, R. (2014) Extinctions of aculeate pollinators in Britain and the role of large-scale agricultural changes. Science 346:1360-1362.  I’m happy to send a PDF to anyone who requests a copy for personal use. 

Notes:

1.  We define “extinction” as ≥ 20 years since the last recorded occurrence of the species in Britain, which is why the data stop at 1994.

2.  We have excluded single early records of species that cannot be verified as representing stable breeding populations.

3. Analyses were performed using the ‘segmented’ library in R (www.r-project.org)

4.  Thanks to Robin Crockett for the figure and the analyses, and Hilary Erenler and Mike Edwards for their input into the study.

Pollinator seminar at Westminster – the official version – and that 1,500 figure

20141028_180501

Last month I wrote a personal account of the National Pollinator Strategy Seminar held at Westminster.  This week the Parliamentary Office for Science and Technology released their official summary of the event plus PDFs of the slides of some of the participants.  They can be downloaded from this website.  It was an interesting seminar and it’s well worth taking time to study these documents; they are very accessible for the non-specialist.

One thing that’s unclear to me from this account is with regard to the statement that:  “there are approximately 1,500 insect species that pollinate food crops and wild plants, including bees, hoverflies, wasps, flies, butterflies, beetles and moths”.  The National Pollinator Strategy also cites that figure, though says “at least 1,500” species.

Where does the 1,500 figure come from?  Does anyone know the original citation?  I genuinely can’t recall if I’ve ever seen it published.

A quick back of the envelope, conservative calculation suggests to me that 1,500 species is too low:

Aculeates (bees plus wasps minus ants) =  500
Butterflies =     59
Macro-moths (assumed 50% flower visitors) =  400
Hoverflies =  250
Other flies (assumed 10% flower visitors) =  700
Beetles (assumed 5% flower visitors) =  200
Total species = 2109


Links are included to the sources of the original diversity figures.  I’ve rounded some of the figures down and the % flowers visitors figures for moths, flies and beetles is pure guestimate based on my field experience.  But they are not likely to be way out, and if anything could be an under-estimate for flies and beetles; moths could be too high, though most species do feed as adults.  Aculeate Hymenoptera (bees and wasps) could also be an over-estimate, but then that figure doesn’t include the non-aculeate “wasps” that frequently visit flowers, for example many ichneumonids and sawflies.

Does it matter?  I think so: as scientists it’s important that we provide the most accurate data that we can to governments and other bodies that may use it for policy, strategy and advocacy.

As always I’d be pleased to receive your comments.

Urban pollinators for urban agriculture (and horticulture!)

P1010430

Over the past few weeks I’ve been thinking a lot about urban pollinators, that is to say bees, hoverflies, butterflies, and other animals, living and foraging in towns and cities.  As I recounted in my recent post about the National Pollinator Strategy seminar at Westminster, Jane Memmott presented some of the first data from the Urban Pollinators Initiative which is looking very interesting.  At the same time, Muzafar Hussain has submitted the first manuscript from his PhD study of urban solitary bees in Northampton, and will hopefully be defending his thesis early next year.  More recently I was asked to examine the PhD thesis of  Rob Fowler at the University of Birmingham, whose focus has been on pollinators across an urban-rural gradient.  Rob did very well and I look forward to seeing his work published.

Interesting though all this work is, it’s largely being done outside the context of crop pollination per se, focusing mainly on the identity and abundance of these urban pollinators.  It’s timely, therefore that a study has just been published by Thebo et al. in the journal Environmental Research Letters entitled  “Global assessment of urban and peri-urban agriculture: irrigated and rainfed croplands” which gives the first comprehensive figures on the extent of agriculture in and around the world’s large towns and cities.  The paper is open-access so you can read its findings for yourself, but the main message is that urban agriculture is more extensive and important than previously assumed, and there are significant implications for food security and water resources.

The research has (justifiably) received quite a lot of publicity in the media, for example on the BBC News website, and is a great contribution to a still limited field of study.  One aspect jumped out at me though; when discussing the limitations of their methods the authors state that: “the scale and methods used……are not structured to capture very small, spatially dispersed areas of urban croplands”.  In other words, urban gardens and allotments are not included in this assessment.  In the UK at least this is a significant limitation as we know that urban fruit and vegetable growing is widespread, though as far as I’m aware there’s no published figures on the volume and value of this local horticulture of food crops.

Which brings us back to urban pollinators: a significant fraction of these crops (large-scale and local garden) requires pollination by insects.  As I reported back in July, in our own urban garden this includes at least 15 crops (strawberries, apples, greengages, cherries, blackcurrants, squashes, courgettes, blackberries, fennel, runner beans, french beans, passion fruit, tomatoes, raspberries, and radish pods).  An integrated study of urban agriculture/horticulture in the context of pollinator diversity and abundance would be a great piece of research and is long overdue.


The National Pollinator Strategy – some reflections

Moth in hand 2014-08-25 19.47.20

After many months of consultation and workshops, the National Pollinator Strategy for England has finally been released by Defra, and can be downloaded from this website.  It reflects an important, wider change in societal attitudes to nature, and specifically the ecosystem services it provides, though the strategy itself is by no means perfect.  I rather wish that it had been a UK-wide strategy, as biodiversity does not respect political boundaries, but such is a the nature of our partly-devolved political system. Wales already has an Action Plan for Pollinators and I hope that the rest of the UK follows, though a strategy for Northern Ireland would surely have to include the Republic of Ireland?

In the following sections I’ve quoted liberally from the summary section of the National Pollinator Strategy, and added a few comments and reflections of my own in italics.  As always, your views and comments would be very welcome.

The 10 year National Pollinator Strategy aims to deliver across five key areas:

1. Supporting pollinators on farmland

  • Working with farmers to support pollinators through the Common Agricultural Policy and with voluntary initiatives to provide food, shelter and nesting sites.
  • Minimising the risks for pollinators associated with the use of pesticides through best practice, including Integrated Pest Management (IPM).

Comment: at the moment many farmers are already pro-actively encouraging pollinators and other wildlife, but most are not.  Will “voluntary initiatives“, including encouraging Integrated Pest Management, be sufficient?  About 70% of the country is farmed and any wildlife conservation strategy has got to include agricultural stakeholders.  But the influence of large agro-chemical businesses should not be under-estimated.  I’ve seen figures suggesting that fields of oil seed rape in this country receive applications of up to 20 different chemicals (biocides and fertilisers) each year.  That represents a significant profit for these companies, who will not want to change the status quo.  Data showing a slow down in the rate of decline of  plants and pollinators in Great Britain, the Netherlands and Belgium may be evidence that CAP agri-environmental schemes have had a positive impact, but I’d like to see more data addressing that question (and not just for pollinators – farmland birds are doing worse than any other category of birds in the UK).

2. Supporting pollinators across towns, cities and the countryside

  • Working with large-scale landowners, and their advisers, contractors and facility managers, to promote simple changes to land management to provide food, shelter and nest sites.
  • Ensuring good practice to help pollinators through initiatives with a wide range of organisations and professional networks including managers of public and amenity spaces, utility and transport companies, brownfield site managers, local authorities, developers and planners
  • Encouraging the public to take action in their gardens, allotments, window boxes and balconies to make them pollinator-friendly or through other opportunities such as community gardening and volunteering on nature reserves.

Comment:  “simple changes to land management” can do a lot for supporting local biodiversity, even in the most unlikely, urban settings, which is the underlying philosophy behind our award-winning Biodiversity Index tool.  Quite a number of local authorities are getting the message that it’s A Good Thing to reduce the frequency of cutting amenity grasslands, both for pollinators and for budgets.  But local authorities are also taking foolish decisions with regard to developing sites that should be protected, and brownfield areas are being specifically targeted for building urban housing, despite the fact that we have long known that they are some of our best sites for pollinators.  How do we reconcile these different priorities?  Brownfield sites by their nature are transitory, early successional habitats, so perhaps local authorities should be encouraged (made?) to have a rolling stock of a minimum proportion of undeveloped brownfield sites as part of their portfolio of land holdings?  Or how about a requirement that all developed areas of brownfield land are replaced by an equivalent area of brown roofs?

3. Enhancing the response to pest and disease risks

  • Working to address pest and disease risks to honey bees whilst further improving beekeepers’ husbandry and management practices to strengthen the resilience of bee colonies.
  • Keeping under active review any evidence of pest and disease risks associated with commercially produced pollinators used for high-value crop production.

Comment:  interestingly there’s no mention of disease risks to non-managed pollinators, yet we know that honey bee diseases can be passed to bumblebees, for instance.

 Actions to support these priority areas:

4. Raising awareness of what pollinators need to survive and thrive

  • Developing and disseminating further advice to a wide range of land owners, managers and gardeners as part of Bees’ Needs.
  • Improving the sharing of knowledge and evidence between scientists, conservation practitioners and non-government organisations (NGOs) to ensure that actions taken to support pollinators are based on up-to-date evidence.

Comment: yes, dissemination of sound, evidence-based knowledge has got to be a priority.

5. Improving evidence on the status of pollinators and the service they provide

  • Developing a sustainable long-term monitoring programme so we better understand their status, the causes of any declines and where our actions will have most effect.
  • Improving our understanding of the value and benefits pollinators provide, and how resilient natural and agricultural systems are to changes in their populations.

Comment: monitoring of pollinators is a real sticking point in the strategy, as there’s still no consensus on what should be monitored, how, where, and how frequently.  This was the subject of a workshop at the Natural History Museum in London that I attended about a year ago, and there’s still much that is undecided.  I know that a partnership led by CEH Wallingford is working on this at the moment, and hopefully a scheme will be in place by next year.  Let’s see what they come up with.

In taking action across these five areas, the National Pollinator Strategy wants to achieve the following outcomes:

  • More, bigger, better, joined-up, diverse and high-quality flower-rich habitats (including nesting places and shelter) supporting our pollinators across the country.
  • Healthy bees and other pollinators which are more resilient to climate change and severe weather events.
  • No further extinctions of known threatened pollinator species.
  • Enhanced awareness across a wide range of businesses, other organisations and the public of the essential needs of pollinators.
  • Evidence of actions taken to support pollinators.

Comment:  “More, bigger, better, joined up…” has been the buzz phrase in British conservation since at least the Lawton Report.  One of the outcomes of that report was the setting up of twelve flagship Nature Improvement Areas (NIAs), one of which is the Nene Valley NIA, a project on which my research group has been working.  The Strategy mentions the NIAs several times and states that “extending the monitoring and evaluation framework for Nature Improvement Areas to include pollinators” is one of its interim aims.  But as I recently mentioned, funding for the NIAs finishes at the end of March 2015 and Defra has indicated that there will be no additional government money.  How will this aim be met?  I’d be very interested to know as the Nene Valley NIA is one of the few which specifically focused on pollinators as part of our remit.  It would be a terrible shame to lose the expertise and momentum that we’ve built up when funding stops next year.  As regards “No further extinctions of known threatened pollinator species“, the talk I gave at SCAPE 2014 was on that very topic and a paper outlining our results is currently in press.  I hope to be able to share those findings with the broad readership of this blog very shortly.