Category Archives: Pollination

Data I’ll never publish 1: flower production and plant size in Lotus corniculatus

Lotus flower production graph 1991

For reasons that will become obvious next week, I’ve been in a reflective mood recently and this first in an occasional series of posts about “data I will never publish” is one of the results of that reflection.

When scientists have been doing research for a few years, most of them start accumulating a back-log of data.  In some cases this is data that may be published in the future (for ecologists that means long-term data sets, which I’ve talked about before) but other data may be fragmentary or simply too limited to be publishable.  Good data are hard won and I never, ever discard data: you never know when it may come in useful.  So in this series I will present such scraps of data that I know I’ll (probably) never publish.  Their purpose is to illustrate interesting points, to stimulate discussion and ideas, and hopefully they might even be of use to other researchers in one way or another (I’m happy to share the raw data, just drop me a line).

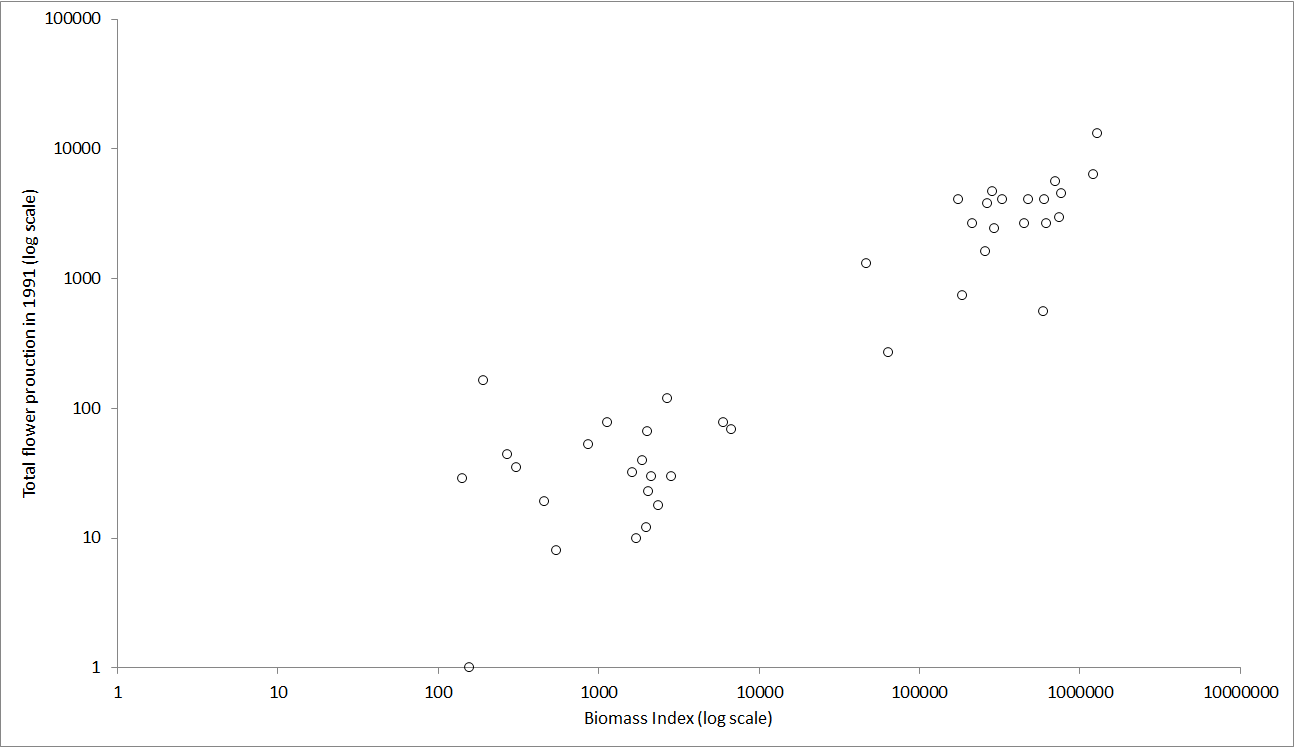
This first data set was collected in the grasslands of Wytham Woods in 1991 when I was a research student.  It subsequently ended up being used in my PhD thesis and in one of the papers that resulted from it (Ollerton & Lack 1998) but not quite in this form, rather embedded within larger analyses.  The graph above (click on it for a more detailed view) shows the relationship between individual plant size (measured using a calibrated non-destructive biomass index that I developed) and total flower production for that year, in the plant species Lotus corniculatus (Fabaceae), commonly known as bird’s-foot trefoil.

This plant is a herbaceous perennial grassland species which can live for quite a long time (at least 50 years).   The data show that plant size and flower production can span 5 orders of magnitude – the maximum number of flowers produced in one year by a single plant in this population was over 13,000, which is astonishing for a low-growing grassland species!

I’ve used this figure in undergraduate lectures as it illustrates several important points about many plants:

  • in theory, there is no upper limit to the potential maximum size of plants.  As long as they have appropriate growing conditions and are not limited by weather or disease or herbivory, they will continue growing.  That’s because they are modular, constructed of iterations of basic units of the plant “body”, and show indeterminate growth.
  • likewise, there is no upper limit to the number of flowers that can be produced because each modular unit can itself produce one or more flowers.
  • plants can be very plastic in their response to the environment.  The data form two clusters; the lower one (smaller plants) is from a sub-population that grew in a grassland that had never been fertilised.  The upper cluster (larger plants) grew in an adjacent area that had previously been an arable field and in which there were still fertiliser residues present in the soil.  The smaller plants are likely to have been older than the larger plants, but the latter had more soil nutrients on which to draw.

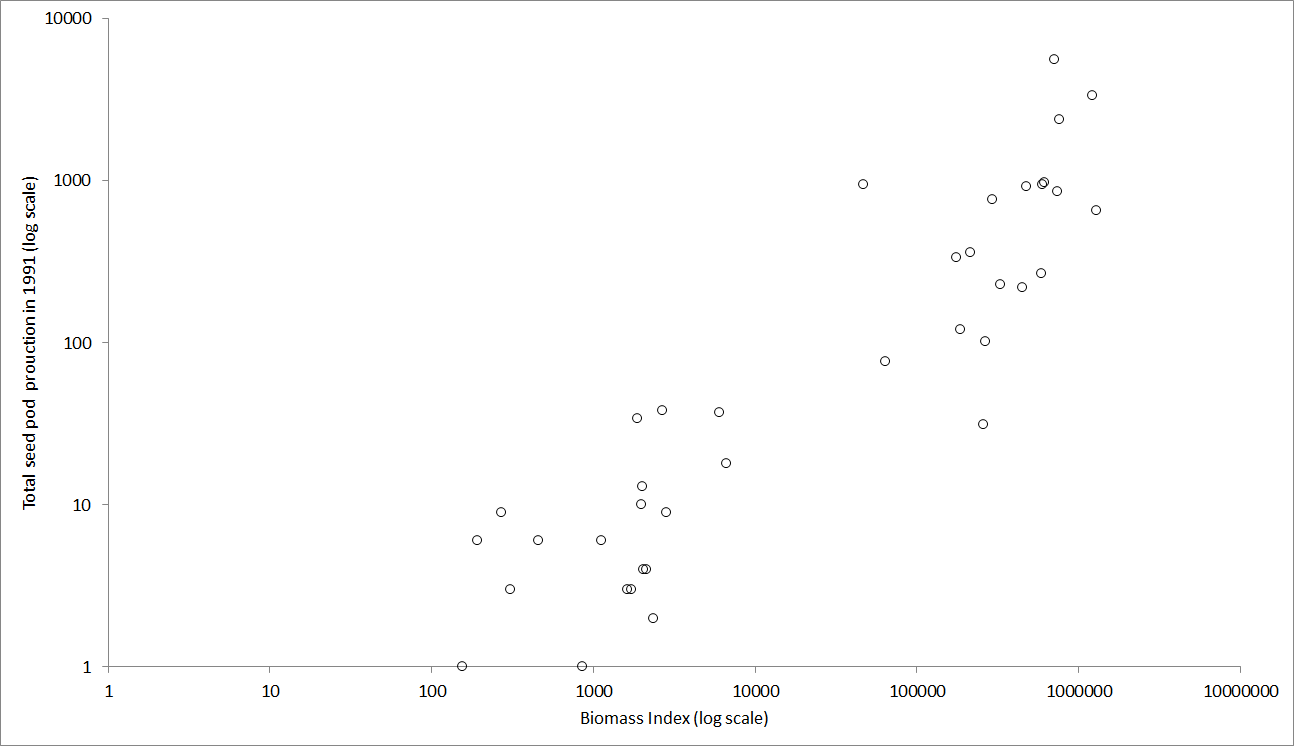
The following graph illustrates the same plants but this time it’s the relationship between biomass and number of seed pods produced.  Still a linear relationship with no sign of a plateau; female reproduction in these plants just goes on and on (as, of course, does male function via pollen dispersal.

Lotus seed pod production graph 1991

This is one of the things that I love about plants: they are so flexible in their response to growing conditions!

Did you remember to thank the insects for Christmas?

2013-12-23 11.44.27

This year I decided not to re-post my traditional “Thank the insects for Christmas” piece, in part because I don’t want to bore the good readers of this blog with too much repetition, but also because the idea has been taken up by the Urban Pollinators Project at the University of Bristol, and developed into an infographic (on which I advised) that you can view here.  The BBC News Website used the information for a nice article called “The insects that made Christmas“.  So look back on your Christmas dinner, if you had one, and give thanks to the many invertebrates that made it happen!

The other reason for not doing a full re-post of that piece is that I was feeling worn out by a long university term that ended not with a whimper, but a stressful double-bang of publication of our pollinator extinctions paper (and the associated media interest, which I may talk about early in 2015) and the release of the results of the Research Excellence Framework, which I coordinated for my department.  We were pleased with the outcome, with over 40% of our research papers rated as “world leading” or “internationally excellent”, and most of the rest being “recognised internationally”.  For a young, mainly teaching-focused, non research-intensive institution such as the University of Northampton (which doesn’t enjoy the facilities and funding of older, larger universities), that’s an impressive result.

A final bit of news is that this blog made it onto the MySciBlog survey 2014, by Paige Brown Jarreau (Louisiana State University) who asked more than 600 science bloggers “to list up to the top three science blogs, other than their own, that they read on a regular basis”.  The initial results can be found at Figshare, and I’ve inserted network graphic below (click on it for a larger view).  The size of a node is proportional to the number of respondents who read that blog regularly and my blog is part of the green section near the top, tucked just under the dominant Dynamic Ecology.  It’s gratifying to know that other bloggers are reading this in significant numbers!

Thanks to everyone who has read my blog over the past year, particularly those who have commented on the ideas and information I’ve presented: best wishes to you all for 2015!

BlogsRead_ModularityClass3_InDegreeSize copy

Extinction of British bees and flower-visiting wasps – a new assessment of rates and causes

Extinction of species is perhaps the most fundamental assault that we as humans can inflict on the rest of the natural world.  Extinctions take a range of forms, from the loss of a whole species (such as the sad case of the St Helena Giant Earwig, recently declared extinct by the IUCN), down to extirpation of local populations.

For an island nation such as Britain, extinctions at a country level are highly significant because there is limited opportunity for species to disperse across the sea and re-colonise areas where they previously lived.  In a new research paper published this week in the journal Science we have addressed the subject of pollinator declines in the UK and asked the following questions:

1.  How many bee and flower-visiting wasp species have gone extinct in the UK?

2.  Is the rate of extinction (e.g. number of species per decade) constant or variable over time?

3.  Can we interpret any patterns in relation to broader societal changes, for example in agricultural policy, conservation strategies, etc?

The research is a collaboration between myself and University of Northampton colleagues Dr Robin Crockett and Dr Hilary Erenler, together with Mike Edwards from the Bees, Wasps & Ants Recording Society (BWARS), the c. 500,000 records of which were used in these analyses.  This is probably the most extensive data set on these insects available for any country and an important resource.

The answer to the first question is that 23 species of bees and flower-visiting wasps have gone extinct, ranging in time from the crabronid wasp Lestica clypeata (last observed in 1853) to the solitary bee Andrena lathyri (not seen since 1990).  All of these species still occur on mainland Europe, so these were country-level extinctions, not species extinctions.

The answer to questions 2 and 3 is that the rate of extinction is highly variable, and by using a novel statistical approach adapted by Robin to analyse the changing rate over time, we found that the main period of species loss followed changes to agricultural policy and practice just after the First World War.  This is much earlier than previously believed: until now it has usually been the Second World War and the subsequent Common Agricultural Policy which have been seen as the main drivers of pollinator loss.  This figure produced by Robin shows the results in detail:

Figure 2 colour

The four periods marked in red are the points where we estimate the rate of extinction changed (with 99% confidence intervals shown in pink).  The most rapid rate of extinction (shown by the solid blue piecewise regression lines and dashed 99% confidence intervals) is from the late 1920s to the late 1950s.  This, we believe, is the cumulative effect of agricultural changes precipitated and then augmented by the First and the Second World Wars, respectively.

The period of extinction from the late 19th into the early 20th centuries was probably caused by increased import of South American guano as soil fertilizer which increased grass productivity at the expense of wild flower diversity.  This reduced reliance on strict rotational cropping, including fallow periods with nectar- and pollen-rich weeds, and N-fixing legume years.  However it was the invention of the Haber Process in 1909, allowing industrial manufacture of inorganic nitrogen fertilizers for the first time, that fundamentally affected British agriculture.

The slow down of the rate of extinction from the early 1960s to the mid 1980s is not easily explained given the continued intensification of farming, encouraged by Common Agricultural Policy subsidies.  It could be due to the most sensitive species having been already lost, or because of conservation initiatives including the establishment of more nature reserves by organisations such as the Wildlife Trusts and the RSPB, habitat restoration and management by groups such as the British Trust for Conservation Volunteers, more farmers going organic, etc.  Or it could be a combination of both, and/or factors we’ve not yet thought of.

The final period of extinctions from 1986 to 1994, where the rate seems to increase, could be seen as evidence against the slowing in the rate of decline of pollinators in north west Europe found by Carvalheiro et al. (2013).  However  we need to be cautious here as there’s a large confidence interval around the calculated extinction rate.  The four extinctions between 1988-1990 could be an isolated cluster, or the start of a further period of relatively high extinction rate.  Only time will tell!

Bees, wasps and other pollinating insects are absolutely vital to the functioning of our natural ecosystems and for a great many agricultural crops.  We’ve known for some time that these insects are declining in Britain but now we can see how historical agricultural changes have caused species to become extinct. The big question is whether these extinctions have stopped or whether they will continue in the future. The species that have been lost to Britain still survive on the Continent and there is the possibility of natural re-colonisation or artificial reintroduction, both of which have occurred in recent years.  However in order for this to be successful we must restore as much natural habitat as possible within our farmland, which after all covers some 70% of the British land surface.  The irony of our findings, of course, is that pollinators are vital for agriculture, as the UK Government’s National Pollinator Strategy recognises.

Studies such as this illustrates the importance of maintaining the year-on-year effort of recording natural history data – the research simply wouldn’t have been possible without the BWARS records, which are mainly collected by amateur naturalists.

The full citation for the paper is:  Ollerton, J., Erenler, H., Edwards, M. & Crockett, R. (2014) Extinctions of aculeate pollinators in Britain and the role of large-scale agricultural changes. Science 346:1360-1362.  I’m happy to send a PDF to anyone who requests a copy for personal use. 

Notes:

1.  We define “extinction” as ≥ 20 years since the last recorded occurrence of the species in Britain, which is why the data stop at 1994.

2.  We have excluded single early records of species that cannot be verified as representing stable breeding populations.

3. Analyses were performed using the ‘segmented’ library in R (www.r-project.org)

4.  Thanks to Robin Crockett for the figure and the analyses, and Hilary Erenler and Mike Edwards for their input into the study.

Pollinator seminar at Westminster – the official version – and that 1,500 figure

20141028_180501

Last month I wrote a personal account of the National Pollinator Strategy Seminar held at Westminster.  This week the Parliamentary Office for Science and Technology released their official summary of the event plus PDFs of the slides of some of the participants.  They can be downloaded from this website.  It was an interesting seminar and it’s well worth taking time to study these documents; they are very accessible for the non-specialist.

One thing that’s unclear to me from this account is with regard to the statement that:  “there are approximately 1,500 insect species that pollinate food crops and wild plants, including bees, hoverflies, wasps, flies, butterflies, beetles and moths”.  The National Pollinator Strategy also cites that figure, though says “at least 1,500” species.

Where does the 1,500 figure come from?  Does anyone know the original citation?  I genuinely can’t recall if I’ve ever seen it published.

A quick back of the envelope, conservative calculation suggests to me that 1,500 species is too low:

Aculeates (bees plus wasps minus ants) =  500
Butterflies =     59
Macro-moths (assumed 50% flower visitors) =  400
Hoverflies =  250
Other flies (assumed 10% flower visitors) =  700
Beetles (assumed 5% flower visitors) =  200
Total species = 2109


Links are included to the sources of the original diversity figures.  I’ve rounded some of the figures down and the % flowers visitors figures for moths, flies and beetles is pure guestimate based on my field experience.  But they are not likely to be way out, and if anything could be an under-estimate for flies and beetles; moths could be too high, though most species do feed as adults.  Aculeate Hymenoptera (bees and wasps) could also be an over-estimate, but then that figure doesn’t include the non-aculeate “wasps” that frequently visit flowers, for example many ichneumonids and sawflies.

Does it matter?  I think so: as scientists it’s important that we provide the most accurate data that we can to governments and other bodies that may use it for policy, strategy and advocacy.

As always I’d be pleased to receive your comments.

Urban pollinators for urban agriculture (and horticulture!)

P1010430

Over the past few weeks I’ve been thinking a lot about urban pollinators, that is to say bees, hoverflies, butterflies, and other animals, living and foraging in towns and cities.  As I recounted in my recent post about the National Pollinator Strategy seminar at Westminster, Jane Memmott presented some of the first data from the Urban Pollinators Initiative which is looking very interesting.  At the same time, Muzafar Hussain has submitted the first manuscript from his PhD study of urban solitary bees in Northampton, and will hopefully be defending his thesis early next year.  More recently I was asked to examine the PhD thesis of  Rob Fowler at the University of Birmingham, whose focus has been on pollinators across an urban-rural gradient.  Rob did very well and I look forward to seeing his work published.

Interesting though all this work is, it’s largely being done outside the context of crop pollination per se, focusing mainly on the identity and abundance of these urban pollinators.  It’s timely, therefore that a study has just been published by Thebo et al. in the journal Environmental Research Letters entitled  “Global assessment of urban and peri-urban agriculture: irrigated and rainfed croplands” which gives the first comprehensive figures on the extent of agriculture in and around the world’s large towns and cities.  The paper is open-access so you can read its findings for yourself, but the main message is that urban agriculture is more extensive and important than previously assumed, and there are significant implications for food security and water resources.

The research has (justifiably) received quite a lot of publicity in the media, for example on the BBC News website, and is a great contribution to a still limited field of study.  One aspect jumped out at me though; when discussing the limitations of their methods the authors state that: “the scale and methods used……are not structured to capture very small, spatially dispersed areas of urban croplands”.  In other words, urban gardens and allotments are not included in this assessment.  In the UK at least this is a significant limitation as we know that urban fruit and vegetable growing is widespread, though as far as I’m aware there’s no published figures on the volume and value of this local horticulture of food crops.

Which brings us back to urban pollinators: a significant fraction of these crops (large-scale and local garden) requires pollination by insects.  As I reported back in July, in our own urban garden this includes at least 15 crops (strawberries, apples, greengages, cherries, blackcurrants, squashes, courgettes, blackberries, fennel, runner beans, french beans, passion fruit, tomatoes, raspberries, and radish pods).  An integrated study of urban agriculture/horticulture in the context of pollinator diversity and abundance would be a great piece of research and is long overdue.


The National Pollinator Strategy – some reflections

Moth in hand 2014-08-25 19.47.20

After many months of consultation and workshops, the National Pollinator Strategy for England has finally been released by Defra, and can be downloaded from this website.  It reflects an important, wider change in societal attitudes to nature, and specifically the ecosystem services it provides, though the strategy itself is by no means perfect.  I rather wish that it had been a UK-wide strategy, as biodiversity does not respect political boundaries, but such is a the nature of our partly-devolved political system. Wales already has an Action Plan for Pollinators and I hope that the rest of the UK follows, though a strategy for Northern Ireland would surely have to include the Republic of Ireland?

In the following sections I’ve quoted liberally from the summary section of the National Pollinator Strategy, and added a few comments and reflections of my own in italics.  As always, your views and comments would be very welcome.

The 10 year National Pollinator Strategy aims to deliver across five key areas:

1. Supporting pollinators on farmland

  • Working with farmers to support pollinators through the Common Agricultural Policy and with voluntary initiatives to provide food, shelter and nesting sites.
  • Minimising the risks for pollinators associated with the use of pesticides through best practice, including Integrated Pest Management (IPM).

Comment: at the moment many farmers are already pro-actively encouraging pollinators and other wildlife, but most are not.  Will “voluntary initiatives“, including encouraging Integrated Pest Management, be sufficient?  About 70% of the country is farmed and any wildlife conservation strategy has got to include agricultural stakeholders.  But the influence of large agro-chemical businesses should not be under-estimated.  I’ve seen figures suggesting that fields of oil seed rape in this country receive applications of up to 20 different chemicals (biocides and fertilisers) each year.  That represents a significant profit for these companies, who will not want to change the status quo.  Data showing a slow down in the rate of decline of  plants and pollinators in Great Britain, the Netherlands and Belgium may be evidence that CAP agri-environmental schemes have had a positive impact, but I’d like to see more data addressing that question (and not just for pollinators – farmland birds are doing worse than any other category of birds in the UK).

2. Supporting pollinators across towns, cities and the countryside

  • Working with large-scale landowners, and their advisers, contractors and facility managers, to promote simple changes to land management to provide food, shelter and nest sites.
  • Ensuring good practice to help pollinators through initiatives with a wide range of organisations and professional networks including managers of public and amenity spaces, utility and transport companies, brownfield site managers, local authorities, developers and planners
  • Encouraging the public to take action in their gardens, allotments, window boxes and balconies to make them pollinator-friendly or through other opportunities such as community gardening and volunteering on nature reserves.

Comment:  “simple changes to land management” can do a lot for supporting local biodiversity, even in the most unlikely, urban settings, which is the underlying philosophy behind our award-winning Biodiversity Index tool.  Quite a number of local authorities are getting the message that it’s A Good Thing to reduce the frequency of cutting amenity grasslands, both for pollinators and for budgets.  But local authorities are also taking foolish decisions with regard to developing sites that should be protected, and brownfield areas are being specifically targeted for building urban housing, despite the fact that we have long known that they are some of our best sites for pollinators.  How do we reconcile these different priorities?  Brownfield sites by their nature are transitory, early successional habitats, so perhaps local authorities should be encouraged (made?) to have a rolling stock of a minimum proportion of undeveloped brownfield sites as part of their portfolio of land holdings?  Or how about a requirement that all developed areas of brownfield land are replaced by an equivalent area of brown roofs?

3. Enhancing the response to pest and disease risks

  • Working to address pest and disease risks to honey bees whilst further improving beekeepers’ husbandry and management practices to strengthen the resilience of bee colonies.
  • Keeping under active review any evidence of pest and disease risks associated with commercially produced pollinators used for high-value crop production.

Comment:  interestingly there’s no mention of disease risks to non-managed pollinators, yet we know that honey bee diseases can be passed to bumblebees, for instance.

 Actions to support these priority areas:

4. Raising awareness of what pollinators need to survive and thrive

  • Developing and disseminating further advice to a wide range of land owners, managers and gardeners as part of Bees’ Needs.
  • Improving the sharing of knowledge and evidence between scientists, conservation practitioners and non-government organisations (NGOs) to ensure that actions taken to support pollinators are based on up-to-date evidence.

Comment: yes, dissemination of sound, evidence-based knowledge has got to be a priority.

5. Improving evidence on the status of pollinators and the service they provide

  • Developing a sustainable long-term monitoring programme so we better understand their status, the causes of any declines and where our actions will have most effect.
  • Improving our understanding of the value and benefits pollinators provide, and how resilient natural and agricultural systems are to changes in their populations.

Comment: monitoring of pollinators is a real sticking point in the strategy, as there’s still no consensus on what should be monitored, how, where, and how frequently.  This was the subject of a workshop at the Natural History Museum in London that I attended about a year ago, and there’s still much that is undecided.  I know that a partnership led by CEH Wallingford is working on this at the moment, and hopefully a scheme will be in place by next year.  Let’s see what they come up with.

In taking action across these five areas, the National Pollinator Strategy wants to achieve the following outcomes:

  • More, bigger, better, joined-up, diverse and high-quality flower-rich habitats (including nesting places and shelter) supporting our pollinators across the country.
  • Healthy bees and other pollinators which are more resilient to climate change and severe weather events.
  • No further extinctions of known threatened pollinator species.
  • Enhanced awareness across a wide range of businesses, other organisations and the public of the essential needs of pollinators.
  • Evidence of actions taken to support pollinators.

Comment:  “More, bigger, better, joined up…” has been the buzz phrase in British conservation since at least the Lawton Report.  One of the outcomes of that report was the setting up of twelve flagship Nature Improvement Areas (NIAs), one of which is the Nene Valley NIA, a project on which my research group has been working.  The Strategy mentions the NIAs several times and states that “extending the monitoring and evaluation framework for Nature Improvement Areas to include pollinators” is one of its interim aims.  But as I recently mentioned, funding for the NIAs finishes at the end of March 2015 and Defra has indicated that there will be no additional government money.  How will this aim be met?  I’d be very interested to know as the Nene Valley NIA is one of the few which specifically focused on pollinators as part of our remit.  It would be a terrible shame to lose the expertise and momentum that we’ve built up when funding stops next year.  As regards “No further extinctions of known threatened pollinator species“, the talk I gave at SCAPE 2014 was on that very topic and a paper outlining our results is currently in press.  I hope to be able to share those findings with the broad readership of this blog very shortly.

A Westminster pollinator seminar and The Great British Big Bee Count

20141028_180450

In the run up to Defra’s publication of a National Pollinator Strategy, due for release some time before Christmas, the Parliamentary Office for Science & Technology yesterday ran a two hour seminar at Westminster.  It was a full meeting in one of the small rooms, and apparently over-subscribed which doesn’t surprise me: there’s huge interest in pollinator conservation in the UK at the moment.  So it would have been better moved to a larger room to allow more scientists, practitioners, MPs, civil servants and other interested parties to attend.  In any case it was a useful couple of hours, with some interesting updates on what’s happening in relation to British pollinators.

The event was chaired by Sarah Newton MP and was kicked off by Adam Vanbergen from the Centre for Ecology and Hydrology who got everyone up to speed by giving an overview of the science of pollination, pollinator diversity, and the issues affecting pollinator populations.  In the process he cited our “How many flowering plants are animal pollinated?” paper which has fast become the default citation to use as evidence to support the ecological importance of biotic pollen transfer.  That’s hugely gratifying and is what it was designed to do.  We now have additional data with wider geographical coverage and I hope to update that analysis in the near future.  A lot of the information Adam was using can be found on the Insect Pollinators Initiative website.

Adam’s talk was followed by a presentation by Simon Potts from the University of Reading who discussed how we value pollination as an ecosystem service and how we can safeguard pollinator abundance and diversity.  There were some stark statistics on the economic contribution of pollinators to crops such as apples, including data from a study by Garratt et al. (2014) which suggests that both quality and quantity of apples could be improved by having more pollinators in British orchards.  Perhaps another way of viewing those data is that the UK apple industry is already experiencing the kind of pollinator deficit that conservationists have predicted?

Jane Memmott from Bristol University was next, presenting the preliminary results of the Urban Pollinators Initiative which is the first comprehensive study of the distribution of pollinators in large British cities.  The data look really exciting and it will be great to see the results finally published as it will make for an interesting comparison with Muzafar’s data on solitary bees in Northampton, the first manuscript from which has recently been submitted to a journal.

Finally Chris Connolly from Dundee University talked about pesticides in a presentation entitled “Why pick on the neonicotinoids?” and provided some disturbing statistics on how little we really know about what happens when the c. 350 types of pesticides (plus about 700 herbicides and fungicides) that we use in modern British agriculture combine in the environment to produce synergistic effects.  It’s also worrying that there is little understanding of the amounts of pesticides being applied because systematic data are not collated.  Chris is a neuroscientist working mainly in a medical context and gave the analogy of how combinations of therapeutic drugs can have unforeseen (even deadly) side effects.  Chris also used an image of Nigel Farage to illustrate a point which was a brave thing to do in the Houses of Parliament in the current political climate, but which got him a big laugh.

There followed 30 minutes of questions and discussion, and I managed to get in a plug for the Biodiversity Index when making a point of how difficult it is to get business to engage with biodiversity.  That led to an interesting conversation afterwards with a consultant that I need to follow up later today.

Out into the unseasonably warm London air by about 6.30pm, there were people standing outside pubs and sitting at cafe tables, as if we were in southern Europe rather than England in late October.  It reinforced some of the things I discussed in a post earlier this summer about climate change and current weather patterns.

Coincidentally (or not) Friends of the Earth released the results of their Great British Bee Count, a Citizen Science project designed to augment the monitoring work being done by specialist groups such as the Bees, Ants and Wasps Recording Society (BWARS).  I have mixed feelings about the Great British Bee Count.  On the one hand it’s great to engage the public in campaigns that raise the awareness of the importance of pollinators, and to get them out looking at bees.  But the reality is that the 832,110 records submitted to the count have very limited scientific value, despite what Friends of the Earth might claim.  That’s because it is very, very difficult to identify bees to even broad groups unless you’ve had some training, and (apart from some distinctive species) impossible to identify to species level unless you are a specialist.  I’ve been studying pollinators for 25 years and there are whole groups within our c. 250 native species that I have great problems identifying, and defer to the opinion of real specialists such as Stuart Roberts, chair of BWARS.

Stuart has made public his concerns at the quality of the data being submitted to the Great British Bee Count, and the fact that records cannot be checked because no photograph was taken and (worse) there are no specimens to compare.  The issues are neatly embodied in the fact that four species which were  recorded from Northern Ireland (Tawny mining bee, Hairy-footed flower bee, Red mason bee, and Tree bumblebee) have never previously been seen in Ireland and can all be confused with other similar species.  Of particular concern is the fact that Friends of the Earth expects the National Biodiversity Network Gateway to archive the data.  If that happens the Great British Bee Count data MUST be kept separate from the high quality, verified data on bee distributions that NBN already possesses, otherwise it will completely devalue the latter.  By all means let’s get the public engaged with pollinators and biodiversity more broadly, which is one of the purposes of this blog after all!  But let’s also be realistic about what can be achieved by these kinds of campaigns.

20141028_180501


Dancing with wolves: more from SCAPE 2014

P1120003

Tovetorp Research Station has a small colony of wolves, though we weren’t allowed to visit them as they are being observed as part of a study of canid behaviour.  But I did see a White-tailed eagle (Haliaeetus albicilla) which was just as good!  And on the last night of the SCAPE meeting there was the usual post-banquet bout of Scando-European dancing by the younger members of the conference, which gave me the idea for the title of this post.

But on to the science!  I’ve already talked a little about some of what I learned or was excited about from the Thursday & Friday talks, and Saturday’s sessions continued in the same vein, with interesting and novel research in abundance, including:

  • species in 166 different plant families lack nectar as a reward, with an estimated 15-20,000 species (from 72 families) utilising buzz pollination (Mario Vallejo-Marin, University of Stirling)
  • Alocasia sarawakensis employs a brood-site pollination system analogous to figs and yucca moths, but without destroying any ovules (Florian Etl, University of Vienna)
  • floral scents are more complex in their geographical and anatomical distribution than we realised, and may be used to cheat pollinators into thinking there is a reward in a flower (Magne Friberg, Amy Parachnowitsch & Rosie Burdon, Uppsala University)
  • exposure to neonicotinoid pesticides can cause very subtle effects on bumblebee behaviour when they forage on apple blossom, which doesn’t seem to translate into an effect on apple pollination (Dara Stanley, Royal Holloway)
  • it may be possible to assign environmental niches to native and introduced pollinators in order to understand how invasive species out-compete native ones (Jonas Kuppler, University of Salzburg)
  • functional diversity of floral traits is greater than that of vegetative traits in alpine plant communities (Robert Junker, University of Salzburg)

As I said before, these are just some of the highlights, there were many others. My own talk was about the rate of extinction of bees and flower-visiting wasps in Britain, involving some new analyses I’ve been doing with colleagues over the past 6 months or so.  The work seemed to be mostly well received, though there was scepticism from some quarters about the methods we’ve used, and a suggestion that there are better ways to assess extinction which I’m going to follow up.

I returned to the UK at 7pm last night.  On the drive home from the airport, Karin asked me what I’d most enjoyed about the conference.  The answer was all of it, of course, but what these meetings really provide is an opportunity to discuss science in an informal, friendly (though rigorous and argumentative!) atmosphere, outside the formal talks.  Not just the science itself, but also the way we do science, manage our careers, and communicate our findings.  I spent some time chatting with Amy Parachnowitsch, who blogs over at Small Pond Science, and her research student Rosie Burdon about the role of blogging in science communication and what we’re aiming to do by releasing these thoughts out onto the internet. Paradoxically these are conversations that are best had face to face I think!

The problem with SCAPE is that it’s over and gone too quickly, but perhaps that’s the point: it leaves us wanting more and looking forward to next year, when it will be in Denmark.  Thanks again to the organising committee for a stimulating and enjoyable few days.  Any pollination scientists, at all stages of their career, who wish to come along to future SCAPEs would be guaranteed a warm welcome and should drop the organisers a line to be added to the mailing list, or search for the Facebook page of the group and ask to be added.

2014-10-25 11.53.13

The bare-foot conference: SCAPE 2014

P1110995

Not strictly bare-foot, most of us are wearing socks and padding around the Tovetorp Research Station in Sweden, where outdoor shoes are banned in the building.  The Scandinavian Association for Pollination Ecology is holding its 28th annual meeting here, starting Thursday evening with three initial talks, and continuing all today.  I’ve posted about SCAPE previously: it’s my favourite conference by a long margin, friendly and informal and attracting some great science.  Although I missed it last year due to my trip to Brazil, coming back this year is a little like coming back to a family gathering, where as well as the elder aunts and uncles, there’s also a large group of younger nieces and nephews, and some long-lost cousins – it’s a great mix of older professors, and newer PhD students.

This is a quick post before we have dinner and the bar opens.  In the last 24 hours I have learned a lot about pollination ecology that I didn’t know before, including:

  • Vincetoxicum hirundinaria does not vary in its outcrossing rate, regardless of the size of population (Anne Muola, Swedish Agricultural University)
  • Arum italicum and Arum maculatum hybridise in some populations (Marion Chartier, University of Vienna)
  • variable weather conditions can result in low bumblebee numbers and increased fly pollination in a north American mountain plant community (Diane Campbell, University of California)
  • nocturnal pollination by moths is more common than expected in Spanish mountain plant communities (Marcos Mendez, Rey Juan Carlos University)
  • “double mutualists” that both pollinate plants and disperse their seeds seem to be more common on islands than elsewhere (Jens Olesen, Aarhus University)
  • colour “purity” is more important than other aspects of flower colouration (Klaus Lunau, Heinrich-Heine University)
  • there’s very little evidence to support any of the current hypotheses regarding the evolution of andromonoecy (Marcos Mendez, again!)

Those are just a few of the highlights from a conference that’s showcasing some of the best pollination ecology research currently being conducted.  Looks like dinner’s ready so I’ll sign off for now.  My talk is tomorrow at 4.30pm – wish me luck!

Biodiversity miscellany

2013-11-23 15.09.46

It’s been a few weeks since my last post, not because I’ve had nothing to say, but rather because there’s been too much to say, and too much to do to have time to say it!  A lot has been happening personally, professionally and in the wider world that I could have talked about, so I’ve summarised a few things below.

Late September saw the start of a new academic year, with all of the organisation and effort that entails.  Recruitment in our Department of Environmental and Geographical Sciences is healthy and the new intake of students are bright and keen.  In addition to my usual teaching and research in the Department I’ve been asked to take on the role of Head of Research and Enterprise for the whole School of Science and Technology.  Which will be interesting as it covers a vast range of subjects, including computing, leather technology, and engineering, as well as the environmental and geographical area with which I’m more familiar.  It’s a two-year post which should be enough time to do some good work.

The Local Nature Partnership annual meeting took place at the university on 25th September. Parliamentary Under Secretary of State for natural environment and science Lord de Mauley popped up again, and gave a better and more focused speech than he did previously at the recent Nature Improvement Area conference in London.   It’s a pity he didn’t stay for the afternoon session as there was a very interesting presentation from the company who are developing the Rushden Lakes site in the Nene Valley. Part of the development is a Site of Special Scientific Interest (SSSI) and it’s within the Special Protection Area, designated for over-wintering birds.  The Wildlife Trust is working closely with the developers and, if the latter deliver what they say they will deliver, it will enhance and protect the site even further.  Time will tell; you can watch a video of the plans here.

Lots of news stories related to biodiversity and conservation have appeared recently, including a scare-mongering piece in the Guardian that “The Earth has lost half its wildlife in the last 40 years” according to a report from WWF.    Of course that’s journalistic crap and the report does not say that at all.  I can’t sum it up any better than did our former student Ian WIlson, now Reserves Manager at Irthlingborough Lakes and Meadows, who commented (on Facebook) that “There have been terrible losses but this sort of misuse of statistics is unhelpful and misleading. It particularly undermines the ecosystem services arguments which suggest that loss of wildlife will directly affect human populations. You can’t maintain that argument and claim that we’ve lost 50% of wildlife over the last 40 years without having to explain why human populations are still so high. Conservation would be better served by more good science and less journalistic sound bites.”  Well said Ian!  Fifty percent of wildlife has not be lost; the statistic is actually that “the Living Planet Index (LPI), which measures more than 10,000 representative populations of mammals, birds, reptiles, amphibians and fish, has declined by 52 per cent since 1970”.  Those “representative populations” are highly skewed towards large, easily counted species of vertebrates, predominantly in temperate areas, and exclude plants and invertebrates – you can download the full report here.  I’m not suggesting that these statistics are anything less than worrying, but the scale of the loss of “wildlife” (in its fullest sense) is not as great as the Guardian’s report suggests.

There’s been huge concern about the disturbing Ebola outbreak in West Africa and beyond, including a statement from IUCN on the links between emergent diseases such as Ebola and loss of biodiversity.  In short, deforestation allows humans to hunt animals in previously unexploited areas, increasing the likelihood that rare and novel diseases that use wild animals as a vector (such as Ebola) can pass to humans.  Worrying, and yet another reason why we need to slow down, and ultimately stop, such habitat destruction.

On a happier note, my colleague Duncan McCollin had a paper entitled ‘Reconstructing long-term ecological data from annual census returns: a test for observer bias in counts of bird populations on Skokholm 1928–2002‘ published in the journal Ecological Indicators.  It highlights a really nice example of an ecological monitoring scheme that, as Duncan puts it, deserves “the recognition of such long-term data for science in terms of an appropriate conservation designation”.

Finally, here’s a link to an impassioned blog post by my friend and colleague Dave Goulson from the University of Sussex.   Dave is a longstanding researcher and campaigner about the adverse effects of neonicotinoid pesticides on pollinators and other biodiversity.  Dave’s post originated as a letter in reply to a (misinformed and biased) opinion piece in The Times, which the newspaper saw fit not to print (freedom of the press, eh?)  It’s well worth reading and sets out the scientific case for the impact of these pesticides.  And if Dave’s blog is not sufficient for you, there’s also been a recent paper from Charles Godfray’s group at Oxford called “A restatement of the natural science evidence base concerning neonicotinoid insecticides and insect pollinators” which received comments and input from many scientists involved in pollinator research (myself included) as well as formal peer review.  Hopefully that’s enough rigour for the sceptics.