Tag Archives: Science

Something for the weekend #2

The second in a regular series of posts to biodiversity-related* items that have caught my attention during the week**.


  • If you’d like to help raise money for bird conservation projects, please consider sponsoring Northants County Bird Recorder Mike Alibone’s team in the Champions of the Flyway event


  • Finally, if you’re the only person on the planet who has not seen a weasel riding on the back of a woodpecker, would you like to?  Of course you would!
*Disclaimer: may sometimes contain non-biodiversity-related links.
**Feel free to recommend links that have caught your eye.

Monitoring the biodiversity impact of the new Waterside Campus

Waterside winter 2014-15 - 2

All human activities can potentially have an impact on the biodiversity of the local environment in which they occur.  That impact can be positive or negative, depending upon how the activity is managed, how impact is mitigated, and the metrics that we use to measure the effects that are occurring.  This is particularly true of large infrastructure developments such as big buildings,  housing developments, roads, and, a category close to home for me at the moment, new university campuses.

I’ve written before about the University of Northampton’s plans to build the new Waterside Campus on brownfield land close to the River Nene, here and here.  It’s a huge project, likely to cost in excess of £330 million on a site covering about 20 hectares.

As you might imagine, such an ambitious scheme has not been without its controversies and there is much debate within the university about changes to how we work and interact with colleagues and students, provision of teaching and research spaces, etc.  There’s also been much discussion within the town, though the general feeling amongst the public (as far as I perceive it) is that bringing the university closer to the centre of Northampton will provide a much-needed economic boost and add significantly to the town’s life.

But what effect will such a development have on the wildlife in and around this peri-urban site, given that it’s in the middle of the Nene Valley Nature Improvement Area and very close to internationally important bird sites?

Over the past few months, together with my colleague Dr Janet Jackson, I’ve been taking part in meetings with the Waterside project’s landscape architects (LUC), other partners from the NIA project board, and the local Wildlife Trust. We’ve been discussing the current plans for the green infrastructure of the campus and thinking about how these can be enhanced.  It’s been a fascinating process as initial disagreements have been negotiated towards compromises and additions that everyone is happy with, balancing budgetary, function and space restrictions with habitat creation and landscape enhancement.

There’s too much been discussed to give a full account at this stage, and it’s possible that some details will change over time, but  the current Ecology Strategy document produced by LUC shows that there will be more than 10 hectares of habitat creation on the site, including species-rich grassland, woodland patches, brown and green roofs, swales and damp areas, and recreated brownfield habitat.  The latter is particularly exciting and something of an experiment, as much of the (albeit limited) current wildlife interest on the site relates to the brownfield element, including the “urban tundra“.

P1100110

To put the 10 hectares into perspective, the adjacent Wildlife Trust Local Nature Reserve of Barnes Meadow is only 20 hectares in area, so it’s potentially increasing that site by 50%.  It’s rare for academic ecologists such as Janet and myself to be able to influence large building developments, so this has been an exciting opportunity for us to make a contribution that (if all goes to plan) will have a positive effect on biodiversity conservation in the Nene Valley.

But how will we know if the Great Waterside Experiment has been a success and that the biodiversity of the new campus is at least as rich, and preferably richer, in species than it was before building took place?

Monitoring of the wildlife is key to this.  Fortunately we have some base-line surveys of birds, plants and invertebrates (including bees and butterflies) from before building started that we can compare with later surveys during and after the campus build.  That process has already started, and with my colleague Dr Duncan McCollin and with two keen second-year students, Jo and Charlie, we have already completed three winter bird surveys to get a sense of how the current site clearance and ground works is affecting the presence of birds in and around the development, including those using the River Nene.  The plan is to continue these surveys up to and after the campus opens in 2018, to give us a data series showing the influence of the campus on bird diversity and numbers.

The initial results are currently being analysed and it appears that the current phase of building has reduced overall bird diversity by about 30%, and that red and amber status birds (of most conservation concern) have been affected more than green status birds, as this figure demonstrates (click on it for a closer view):

Waterside bird surveys

These rough figures hide a lot of detail, however.  For example, there has been some addition of species in 2014-15 that were not recorded in 2012-13, including Coot, Treecreeper and the amber-status Stock dove.  More importantly, some of the amber status birds that we didn’t record on site in 2014-15, we know from additional surveys are still present in habitats within 500 metres of the development, for example Dunnock, Green woodpecker, and Bullfinch.  Similarly, red status birds such as resident Starling, and winter migrant Fieldfare and Redwing occur within at least one kilometre of the site.  Hopefully as the building work progresses towards completion these (and other) species will return, so at the moment we’re not too concerned by their disappearance from the site.

Later in the spring we will conduct a couple of breeding bird surveys, and continue surveying for the next few years until the campus opens in 2018.  Only then will we see exactly how successful our influence has been.  In the mean time I’ll report back as and when we have more data to share.

Waterside winter 2014-15


Clever crows!

Clever crows

Back in October I was staring out of the window of the office that I share with my colleagues, something I often do when I’m pondering a question or trying to add a tick to our “Birds Seen Out of the Window” list*, when I spotted something odd.  A pair of crows had focused their attention on a brown patch of lawn and appeared to be eating the grass.  I’m not much of a birder but I do know enough about crows to realise that grass is not a regular feature of their diet.  The same behaviour was observed a few other times after that, and on other occasions magpies were seen doing the same thing.  What could be going on?

Once I’d taken a closer look at the patch of dead grass the explanation was clear.  During our first year undergraduate induction week about a month earlier there had been a barbeque set up on that spot which had leaked hot fat onto the grass.  What the birds were eating was dead grass coated in lard, a useful source of fat to store for the cold conditions of the oncoming winter.

That’s one of things I love about urban birds such as corvids and gulls: they are adaptable and will exploit any resource that becomes available.  But how had they located the patch of fatty grass?  Were they simply exploring the lawn and stumbled across it by accident?  Seems plausible especially as they often feed on earthworms on the adjacent parkland.  Could they smell it?  The acuity of birds’ sense of smell has been the topic of considerable debate, but that’s certainly a possibility.

I was reminded to post this (originally half-written before Christmas) by a story on the BBC news website this morning about a young girl in the USA who receives gifts from the crows in her garden.  If you’ve not read it, please do: it’s a wonderful example of positive interactions between humans and the rest of biodiversity.

Crows (and other corvids) get a bad press, being often described as “evil” (surely a term that only applies to humans) and blamed for the demise of “nicer” birds – a reputation that is not completely justified, as a recent post on Kaeli Swift’s crow research site demonstrates.

So, learn to appreciate (even love) the crows in your local neighborhood; they will reward you with some entertainment as you watch their behaviour, if not necessarily with gifts.


*currently standing at 19 species and rising every month.

Building a blog readership takes time

Blog stats figure

This morning I had a very constructive meeting with some colleagues to discuss setting up a new blog/podcast series for the university.  It reminded me that I wanted to post something about how long it takes to build up a blog readership , specifically in the sciences.  The figure above shows the monthly number of views of my blog from its inception in March 2012 up to January 2015.  The line is a second-order polynomial, just to aid interpretation rather than to make any kind of statistical inference.

For the first year and a half of the blog’s life, monthly views were typically in the range 200-400, occasionally getting as high as 600.  Only after that was there a trend of increasing numbers month-on-month, but even that was not consistent, with some periods of low readership.  In part this relates to how frequently one blogs: more frequent = more monthly views, and I have been posting more often of late.  But that’s only part of the story and the figure also demonstrates that it takes time to build a readership for a blog.  For example, 4 posts in March 2012 attracted 402 views; the same number of posts in April 2014 received 1,469 views, and 2,120 in December 2014.

A lot of scientists (particularly early career) are starting to blog, sometimes because they think it’s the right thing to do: they see others doing it, and it’s encouraged by funding agencies, etc.  Sometimes these blogs are very successful; other times they falter after a few posts, perhaps because the writer loses interest.  I’m not in a position to offer much advice about blogging as I’ve only my own experience on which to draw, but I would say that it requires persistence: don’t assume that you’re going to get a big audience from the start, it takes time to build a readership.

Evolving a naturalist – happy birthday to me!

Jeff in the tee-pee

Somehow, today is my 50th birthday.  So I thought I’d mark it with a short post about my personal evolution as a naturalist and, ultimately, professional scientist.

One of the great things about the internet and social media such as Facebook is that you can make exciting discoveries on a weekly basis.  Recently I found out something that means a lot to me on a very personal level: I discovered that a family* who lived in the same street when I was growing up in Sunderland in the 60s and 70s have digitised some old home movies and made them available on YouTube.  In our digital age in which every phone and camera can capture and share events as they happen, it’s sometimes easy to forget that owning a movie camera in the 60s was quite a rarity and the majority of kids living at that time were never filmed.   

These movies are exciting not just because one of them shows me aged about 5 years (in the blue shirt) playing with friends (I’m there from 3’53”) but because it documents, in colour and moving pictures, one of the reasons why I became a professional naturalist with a deep fascination for biodiversity. 

The grassland in which we are erecting a tee-pee is not some country meadow, the kind of wild rural landscape cited by so many other naturalists as inspiring their childhood fascination with natural history.  These grasslands had arisen spontaneously on cleared demolition sites, following the removal of Victorian terraced housing and tenement blocks, some of which were slums and others that had suffered bomb damage in the Second World War (now that does make me sound old!)

Up until the 1950s this area had been very built up, with the houses, shops and pubs serving the local families who were employed mainly in the shipyards and coal mines to the north of the town.  You can get a sense of how urban it was from this 1898 map of Southwick; the places I refer to are just south-west of The Green to the left of the map. 

Following demolition the sites were left to their own ends, and were colonised by plants, insects, birds and mammals from patches of habitat closer to the river that had either been cleared of buildings earlier in the century, or which had never been built upon at all.  There are some nice areas of magnesian limestone grassland nearby along the higher banks of the River Wear valley, and typical calcicole plants such as Greater Knapweed (Centaurea scabiosa) could be found on these post-demolition grasslands.  In fact, in the absence of horse chestnut trees, we used to play a version of conkers using the unripe seed heads of Greater Knapweed.  Was that an echo of earlier children’s games in Britain, prior to the introduction of horse chestnuts in the 17th century?  Apparently similar games were played with snail shells and hazelnuts.  

If you watch the opening minute of this piece of footage from the same series, and ignore the girls posing and playing in the foreground, the background reveals a rich flora of plants, with butterflies hopping between flowers.  The first bird species that I can remember identifying, and being fascinated by its bright colours, was Goldfinch (Carduelis carduelis) feeding on the seeds of tall thistles in the very area where this was filmed.   The first butterfly that I could put a name to was the Small Tortoiseshell (Aglais urticae), also feeding on thistles, but this time on the nectar-rich flower heads, as a pollinator.  We’d collect its caterpillars from the nearby nettles and raise them in jars.

So you don’t have to have had a rural upbringing to appreciate and benefit from nature, and to later influence your profession and passions, any piece of land can inspire interest in kids, regardless of its origin, if nature is left to colonise. Unmanaged, semi-wild green space within towns and cities has huge value, both for wildlife and for the culture of childhood.  They need to be protected just as much as rural nature reserves, including the generally disparaged but actually biodiverse “brownfield” sites, as Sarah Arnold has discussed in a recent blog post.

Some of the riverside grasslands still remain and I hope that they are fascinating new generations of kids with their colour and diversity and flouncing butterflies. But the post-industrial grasslands on which I played and looked for bugs and flowers are all gone; they were cleared and built upon in a flurry of housing and retail development in the 1980s.  Perhaps in the future they may return if those buildings are themselves demolished and the land allowed to lie undisturbed for a while.  That is what nature does: it ebbs and flows across our landscapes in response to human, and natural, interventions, endlessly changing and endlessly fascinating to the curious minds of children and scientists, no matter how old they are.


*My sincere thanks to the Scrafton family who took the original footage, made it available on YouTube, and gave me permission to use it in this post.

Data I’ll never publish 1: flower production and plant size in Lotus corniculatus

Lotus flower production graph 1991

For reasons that will become obvious next week, I’ve been in a reflective mood recently and this first in an occasional series of posts about “data I will never publish” is one of the results of that reflection.

When scientists have been doing research for a few years, most of them start accumulating a back-log of data.  In some cases this is data that may be published in the future (for ecologists that means long-term data sets, which I’ve talked about before) but other data may be fragmentary or simply too limited to be publishable.  Good data are hard won and I never, ever discard data: you never know when it may come in useful.  So in this series I will present such scraps of data that I know I’ll (probably) never publish.  Their purpose is to illustrate interesting points, to stimulate discussion and ideas, and hopefully they might even be of use to other researchers in one way or another (I’m happy to share the raw data, just drop me a line).

This first data set was collected in the grasslands of Wytham Woods in 1991 when I was a research student.  It subsequently ended up being used in my PhD thesis and in one of the papers that resulted from it (Ollerton & Lack 1998) but not quite in this form, rather embedded within larger analyses.  The graph above (click on it for a more detailed view) shows the relationship between individual plant size (measured using a calibrated non-destructive biomass index that I developed) and total flower production for that year, in the plant species Lotus corniculatus (Fabaceae), commonly known as bird’s-foot trefoil.

This plant is a herbaceous perennial grassland species which can live for quite a long time (at least 50 years).   The data show that plant size and flower production can span 5 orders of magnitude – the maximum number of flowers produced in one year by a single plant in this population was over 13,000, which is astonishing for a low-growing grassland species!

I’ve used this figure in undergraduate lectures as it illustrates several important points about many plants:

  • in theory, there is no upper limit to the potential maximum size of plants.  As long as they have appropriate growing conditions and are not limited by weather or disease or herbivory, they will continue growing.  That’s because they are modular, constructed of iterations of basic units of the plant “body”, and show indeterminate growth.
  • likewise, there is no upper limit to the number of flowers that can be produced because each modular unit can itself produce one or more flowers.
  • plants can be very plastic in their response to the environment.  The data form two clusters; the lower one (smaller plants) is from a sub-population that grew in a grassland that had never been fertilised.  The upper cluster (larger plants) grew in an adjacent area that had previously been an arable field and in which there were still fertiliser residues present in the soil.  The smaller plants are likely to have been older than the larger plants, but the latter had more soil nutrients on which to draw.

The following graph illustrates the same plants but this time it’s the relationship between biomass and number of seed pods produced.  Still a linear relationship with no sign of a plateau; female reproduction in these plants just goes on and on (as, of course, does male function via pollen dispersal.

Lotus seed pod production graph 1991

This is one of the things that I love about plants: they are so flexible in their response to growing conditions!

Student field trip to Summer Leys Nature Reserve – birds, bins and biting winds!

2015-01-29 12.38.19

Field trips are a vital component of any university degree course that includes within it elements of ecology, organismal biology, geography or environmental science.  Learning about the natural environment via lectures, books and seminars is one thing: experiencing it first hand is quite another, and adds significantly to a deeper understanding of complex environmental issues such as nature reserve management.  For that reason at the University of Northampton we’ve always strove to maintain as much field experience as possible within our degree programmes, including long field courses to the South-West USA and Tenerife (as I’ve previously documented), day trips to places such as Wicken Fen, and shorter sessions in and around our campus.

An annual winter visit to Summer Leys Nature Reserve has been a feature of our first year undergraduate teaching for many years, and focuses on the bird life to be found in this flooded and restored gravel pit.  Of particular interest at this time of year are the over-wintering waders and wild fowl, for which the reserve has been designated Site of Special Scientific Interest and Special Protected Area status.  The latter is a European-level designation which reflects the international importance of the Nene Valley for bird life.

This year’s trip took place on Thursday, which was initially bright but cold.  The field trip is not compulsory so many students decided not to turn up.  Those that attended had a great time walking the circuit around the reserve, visiting the bird hides, and learning the intricacies of both duck identification and how a site such as this is managed.

2015-01-29 11.34.23

As we walked and recorded I kept a running total of the birds that we identified. Highlights included three Great White Egrets standing together on one of the islands, the greatest number I’ve seen at one time in the county, and an indication of much more common these spectacular birds have become in the last decade, as county bird recorder Mike Alibone has discussed on his blog.  They have bred in Somerset since 2012 and hopefully will do so in the Nene Valley in the not too distant future    You can just make out the birds in the centre of this image:

2015-01-29 11.31.19

Another highlight was the large number of Bullfinches that we saw foraging along the paths and in the low trees, at least 20, all of which were females.  Some were very confiding and we could approach them to within a couple of metres, such as this one:

2015-01-29 11.23.03

Ducks were plentiful, with good numbers of Wigeon, Gadwall, Tufted Duck and Mallard, fewer Shoveler, a couple of Goldeneye, and a single Pochard.  There were also large flocks of Lapwing and a couple of unidentified waders, possibly Redshank.

2015-01-29 12.37.47

The final total of birds was a respectable 39 species and our half-day trip ended as cold winds brought in heavy cloud, rain and then finally a sudden fall of snow. By which time we were back in the warmth of the campus, enjoying a cup of tea and catching up with emails.


What do academics do once the research is published?

P1010513

At the University of Northampton we run a programme of generic training workshops aimed at research students (MPhil and PhD) from across all disciplines.  I contribute to several, including one called “Getting Published”, usually run with my colleague Professor Ian Livingstone.  This focuses on academic papers/articles (phraseology varies with subject) and covers all of what you might expect such a workshop to feature, including asking about motivations for wanting to publish research*, when is the right time to publish your research**, issues about co-authorship***, and so forth.

One of the key aspects of the workshop is a flow chart of the process of getting published, beginning at “do the research”, moving on to writing it up, choosing a journal, submitting to a journal, peer review, dealing with reviewers’ comments, writing a covering letter, coping with rejection, re-submission to the same or a different journal, celebrating acceptance, etc.  All fairly standard stuff.

By this point we’re about three-quarters of the way through the workshop, so I ask a question:

“OK, you’ve gone through the whole process (which can take anything from months to years) and your paper has been published.  You’re very pleased, of course.  What do you do next?”

Responses at this point are typically a blank expression, or perhaps “What else is there to do?  The paper’s published, we’ve done our job.  Move on to the next”.  In other words, the general feeling seems to be that the process stops when the research is published.  I politely suggest that this is not so, that you’re still only part-way through the process, and explain why, starting with this table:

Clinical:                                  48.9%

Biological Sciences:           37.8%

Environment:                       37.3%

Physical Sciences:              42.3%

Social Sciences:                   55.4%

Business:                                57.2%

Humanities:                          77.5%

These figures are the percentages of un-cited research papers (in 2005, by broad discipline) published in the UK for the period 2000 to 2004.   The total number of un-cited papers is 122,771****.  There are other similar statistics available, some with broader time windows, but they all point to the same conclusion: in all disciplines, a high proportion of research papers are never referred to by other researchers in the field.  And in some disciplines it’s the majority of papers.

That’s not to say that the research is no good, or even that it’s not being read, but it’s certainly not being cited.  Citation is not the only measure of the “quality” of a piece of work of course, but it at least indicates that peers have read the work, and citation is central to a range of widely used metrics, including the h-index.

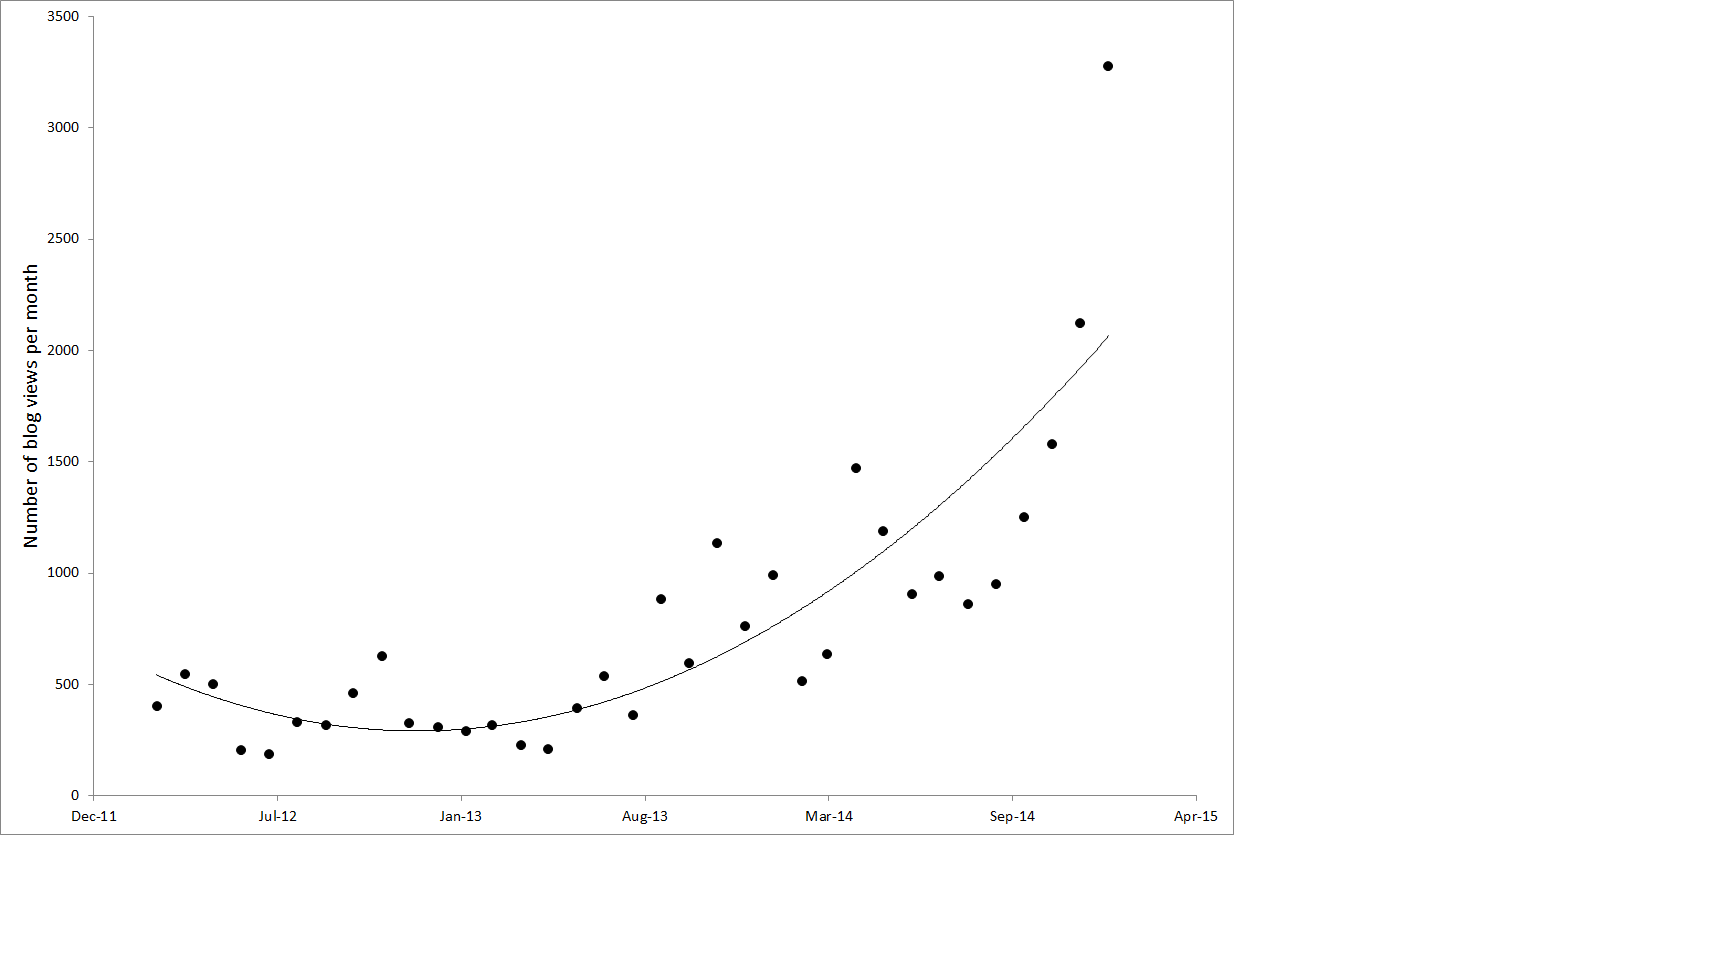
This usually comes as a shock to the postgrads, as it does to many established academics!  The low average citation rate of papers is mainly a response to the sheer volume of research currently being published, as I’ve discussed previously in relation to the field of pollination ecology.

How do researchers in a field decide which papers they are going to read and/or cite, and which they ignore?  It’s been suggested that academics often have quite conservative citing patterns, referring again and again to the same work or authors in their own papers.  How can a researcher break through this conservatism and have their own work cited?

One answer is to promote your work after it’s published and the workshop offers some ideas on how to do this:

  • Send PDFs of your papers to other researchers, whether you know them personally or not.  I’m always happy to receive copies of papers that I might otherwise miss.
  • Deposit copies with your institutional electronic repository (at Northampton that’s NECTAR)
  • Tell the world about it using social media, either general (Twitter, Facebook, LinkedIn) or academic (ResearchGate, academia.edu)
  • Send announcements to email discussion groups in your field
  • If you blog, write a post about it (as I did for the pollinator extinctions paper last month)
  • If the work is particularly novel/important/high impact, consider writing a press release with your institution’s press office, or at least a news item on the website.
  • Consider writing up your research as a non-academic piece in a magazine or newspaper for a wider, public audience (see comment below)
  • Present the work (and cite it) at conferences & seminars (the old fashioned way…..)

This kind of “self promotion” is anathema to some academics, for reasons that are not clear to me but may relate to misguided notions about sullying the purity of their work with grubby advertising, something that’s been discussed over at the Dynamic Ecology blog.

But if you don’t promote your work, no one else will do it for you!  Doing research and writing books and papers is a creative endeavour just as much as any of the arts or music.  Would we expect an artist to not advertise the work they do?  Or a musician to keep compositions to themselves.  No, they have exhibitions and concerts, and use advertising in all its forms, to promote their work.

Ultimately a piece of research is only as good as its reception by the audience at which it’s aimed: some brilliant research findings have been ignored for decades because it had disappeared into academic obscurity.  This is likely to happen even more in the future, I’d suggest, given the amount of work that’s being published.

Do you have other strategies for promoting your work?  Or do you disagree with some of what I’ve said?  Feel free to comment, I’d be happy to hear from you.

*”earning money” occasionally pops up as a (naive) reason, so we have to point out that academics rarely get paid for their academic publishing, other than (meagre) book royalties.

**As soon as is feasible, even if it’s a short literature review.

***Make sure everyone, especially supervisors, is clear about which work will be co-authored, which will not, and why.

****Source: PSA target metrics for the UK research base, Office of Science and Technology, DTI (2005)

Extinction of British bees and flower-visiting wasps – a new assessment of rates and causes

Extinction of species is perhaps the most fundamental assault that we as humans can inflict on the rest of the natural world.  Extinctions take a range of forms, from the loss of a whole species (such as the sad case of the St Helena Giant Earwig, recently declared extinct by the IUCN), down to extirpation of local populations.

For an island nation such as Britain, extinctions at a country level are highly significant because there is limited opportunity for species to disperse across the sea and re-colonise areas where they previously lived.  In a new research paper published this week in the journal Science we have addressed the subject of pollinator declines in the UK and asked the following questions:

1.  How many bee and flower-visiting wasp species have gone extinct in the UK?

2.  Is the rate of extinction (e.g. number of species per decade) constant or variable over time?

3.  Can we interpret any patterns in relation to broader societal changes, for example in agricultural policy, conservation strategies, etc?

The research is a collaboration between myself and University of Northampton colleagues Dr Robin Crockett and Dr Hilary Erenler, together with Mike Edwards from the Bees, Wasps & Ants Recording Society (BWARS), the c. 500,000 records of which were used in these analyses.  This is probably the most extensive data set on these insects available for any country and an important resource.

The answer to the first question is that 23 species of bees and flower-visiting wasps have gone extinct, ranging in time from the crabronid wasp Lestica clypeata (last observed in 1853) to the solitary bee Andrena lathyri (not seen since 1990).  All of these species still occur on mainland Europe, so these were country-level extinctions, not species extinctions.

The answer to questions 2 and 3 is that the rate of extinction is highly variable, and by using a novel statistical approach adapted by Robin to analyse the changing rate over time, we found that the main period of species loss followed changes to agricultural policy and practice just after the First World War.  This is much earlier than previously believed: until now it has usually been the Second World War and the subsequent Common Agricultural Policy which have been seen as the main drivers of pollinator loss.  This figure produced by Robin shows the results in detail:

Figure 2 colour

The four periods marked in red are the points where we estimate the rate of extinction changed (with 99% confidence intervals shown in pink).  The most rapid rate of extinction (shown by the solid blue piecewise regression lines and dashed 99% confidence intervals) is from the late 1920s to the late 1950s.  This, we believe, is the cumulative effect of agricultural changes precipitated and then augmented by the First and the Second World Wars, respectively.

The period of extinction from the late 19th into the early 20th centuries was probably caused by increased import of South American guano as soil fertilizer which increased grass productivity at the expense of wild flower diversity.  This reduced reliance on strict rotational cropping, including fallow periods with nectar- and pollen-rich weeds, and N-fixing legume years.  However it was the invention of the Haber Process in 1909, allowing industrial manufacture of inorganic nitrogen fertilizers for the first time, that fundamentally affected British agriculture.

The slow down of the rate of extinction from the early 1960s to the mid 1980s is not easily explained given the continued intensification of farming, encouraged by Common Agricultural Policy subsidies.  It could be due to the most sensitive species having been already lost, or because of conservation initiatives including the establishment of more nature reserves by organisations such as the Wildlife Trusts and the RSPB, habitat restoration and management by groups such as the British Trust for Conservation Volunteers, more farmers going organic, etc.  Or it could be a combination of both, and/or factors we’ve not yet thought of.

The final period of extinctions from 1986 to 1994, where the rate seems to increase, could be seen as evidence against the slowing in the rate of decline of pollinators in north west Europe found by Carvalheiro et al. (2013).  However  we need to be cautious here as there’s a large confidence interval around the calculated extinction rate.  The four extinctions between 1988-1990 could be an isolated cluster, or the start of a further period of relatively high extinction rate.  Only time will tell!

Bees, wasps and other pollinating insects are absolutely vital to the functioning of our natural ecosystems and for a great many agricultural crops.  We’ve known for some time that these insects are declining in Britain but now we can see how historical agricultural changes have caused species to become extinct. The big question is whether these extinctions have stopped or whether they will continue in the future. The species that have been lost to Britain still survive on the Continent and there is the possibility of natural re-colonisation or artificial reintroduction, both of which have occurred in recent years.  However in order for this to be successful we must restore as much natural habitat as possible within our farmland, which after all covers some 70% of the British land surface.  The irony of our findings, of course, is that pollinators are vital for agriculture, as the UK Government’s National Pollinator Strategy recognises.

Studies such as this illustrates the importance of maintaining the year-on-year effort of recording natural history data – the research simply wouldn’t have been possible without the BWARS records, which are mainly collected by amateur naturalists.

The full citation for the paper is:  Ollerton, J., Erenler, H., Edwards, M. & Crockett, R. (2014) Extinctions of aculeate pollinators in Britain and the role of large-scale agricultural changes. Science 346:1360-1362.  I’m happy to send a PDF to anyone who requests a copy for personal use. 

Notes:

1.  We define “extinction” as ≥ 20 years since the last recorded occurrence of the species in Britain, which is why the data stop at 1994.

2.  We have excluded single early records of species that cannot be verified as representing stable breeding populations.

3. Analyses were performed using the ‘segmented’ library in R (www.r-project.org)

4.  Thanks to Robin Crockett for the figure and the analyses, and Hilary Erenler and Mike Edwards for their input into the study.

Pollinator seminar at Westminster – the official version – and that 1,500 figure

20141028_180501

Last month I wrote a personal account of the National Pollinator Strategy Seminar held at Westminster.  This week the Parliamentary Office for Science and Technology released their official summary of the event plus PDFs of the slides of some of the participants.  They can be downloaded from this website.  It was an interesting seminar and it’s well worth taking time to study these documents; they are very accessible for the non-specialist.

One thing that’s unclear to me from this account is with regard to the statement that:  “there are approximately 1,500 insect species that pollinate food crops and wild plants, including bees, hoverflies, wasps, flies, butterflies, beetles and moths”.  The National Pollinator Strategy also cites that figure, though says “at least 1,500” species.

Where does the 1,500 figure come from?  Does anyone know the original citation?  I genuinely can’t recall if I’ve ever seen it published.

A quick back of the envelope, conservative calculation suggests to me that 1,500 species is too low:

Aculeates (bees plus wasps minus ants) =  500
Butterflies =     59
Macro-moths (assumed 50% flower visitors) =  400
Hoverflies =  250
Other flies (assumed 10% flower visitors) =  700
Beetles (assumed 5% flower visitors) =  200
Total species = 2109


Links are included to the sources of the original diversity figures.  I’ve rounded some of the figures down and the % flowers visitors figures for moths, flies and beetles is pure guestimate based on my field experience.  But they are not likely to be way out, and if anything could be an under-estimate for flies and beetles; moths could be too high, though most species do feed as adults.  Aculeate Hymenoptera (bees and wasps) could also be an over-estimate, but then that figure doesn’t include the non-aculeate “wasps” that frequently visit flowers, for example many ichneumonids and sawflies.

Does it matter?  I think so: as scientists it’s important that we provide the most accurate data that we can to governments and other bodies that may use it for policy, strategy and advocacy.

As always I’d be pleased to receive your comments.