Tag Archives: Nature

Monitoring the biodiversity impact of the new Waterside Campus

Waterside winter 2014-15 - 2

All human activities can potentially have an impact on the biodiversity of the local environment in which they occur.  That impact can be positive or negative, depending upon how the activity is managed, how impact is mitigated, and the metrics that we use to measure the effects that are occurring.  This is particularly true of large infrastructure developments such as big buildings,  housing developments, roads, and, a category close to home for me at the moment, new university campuses.

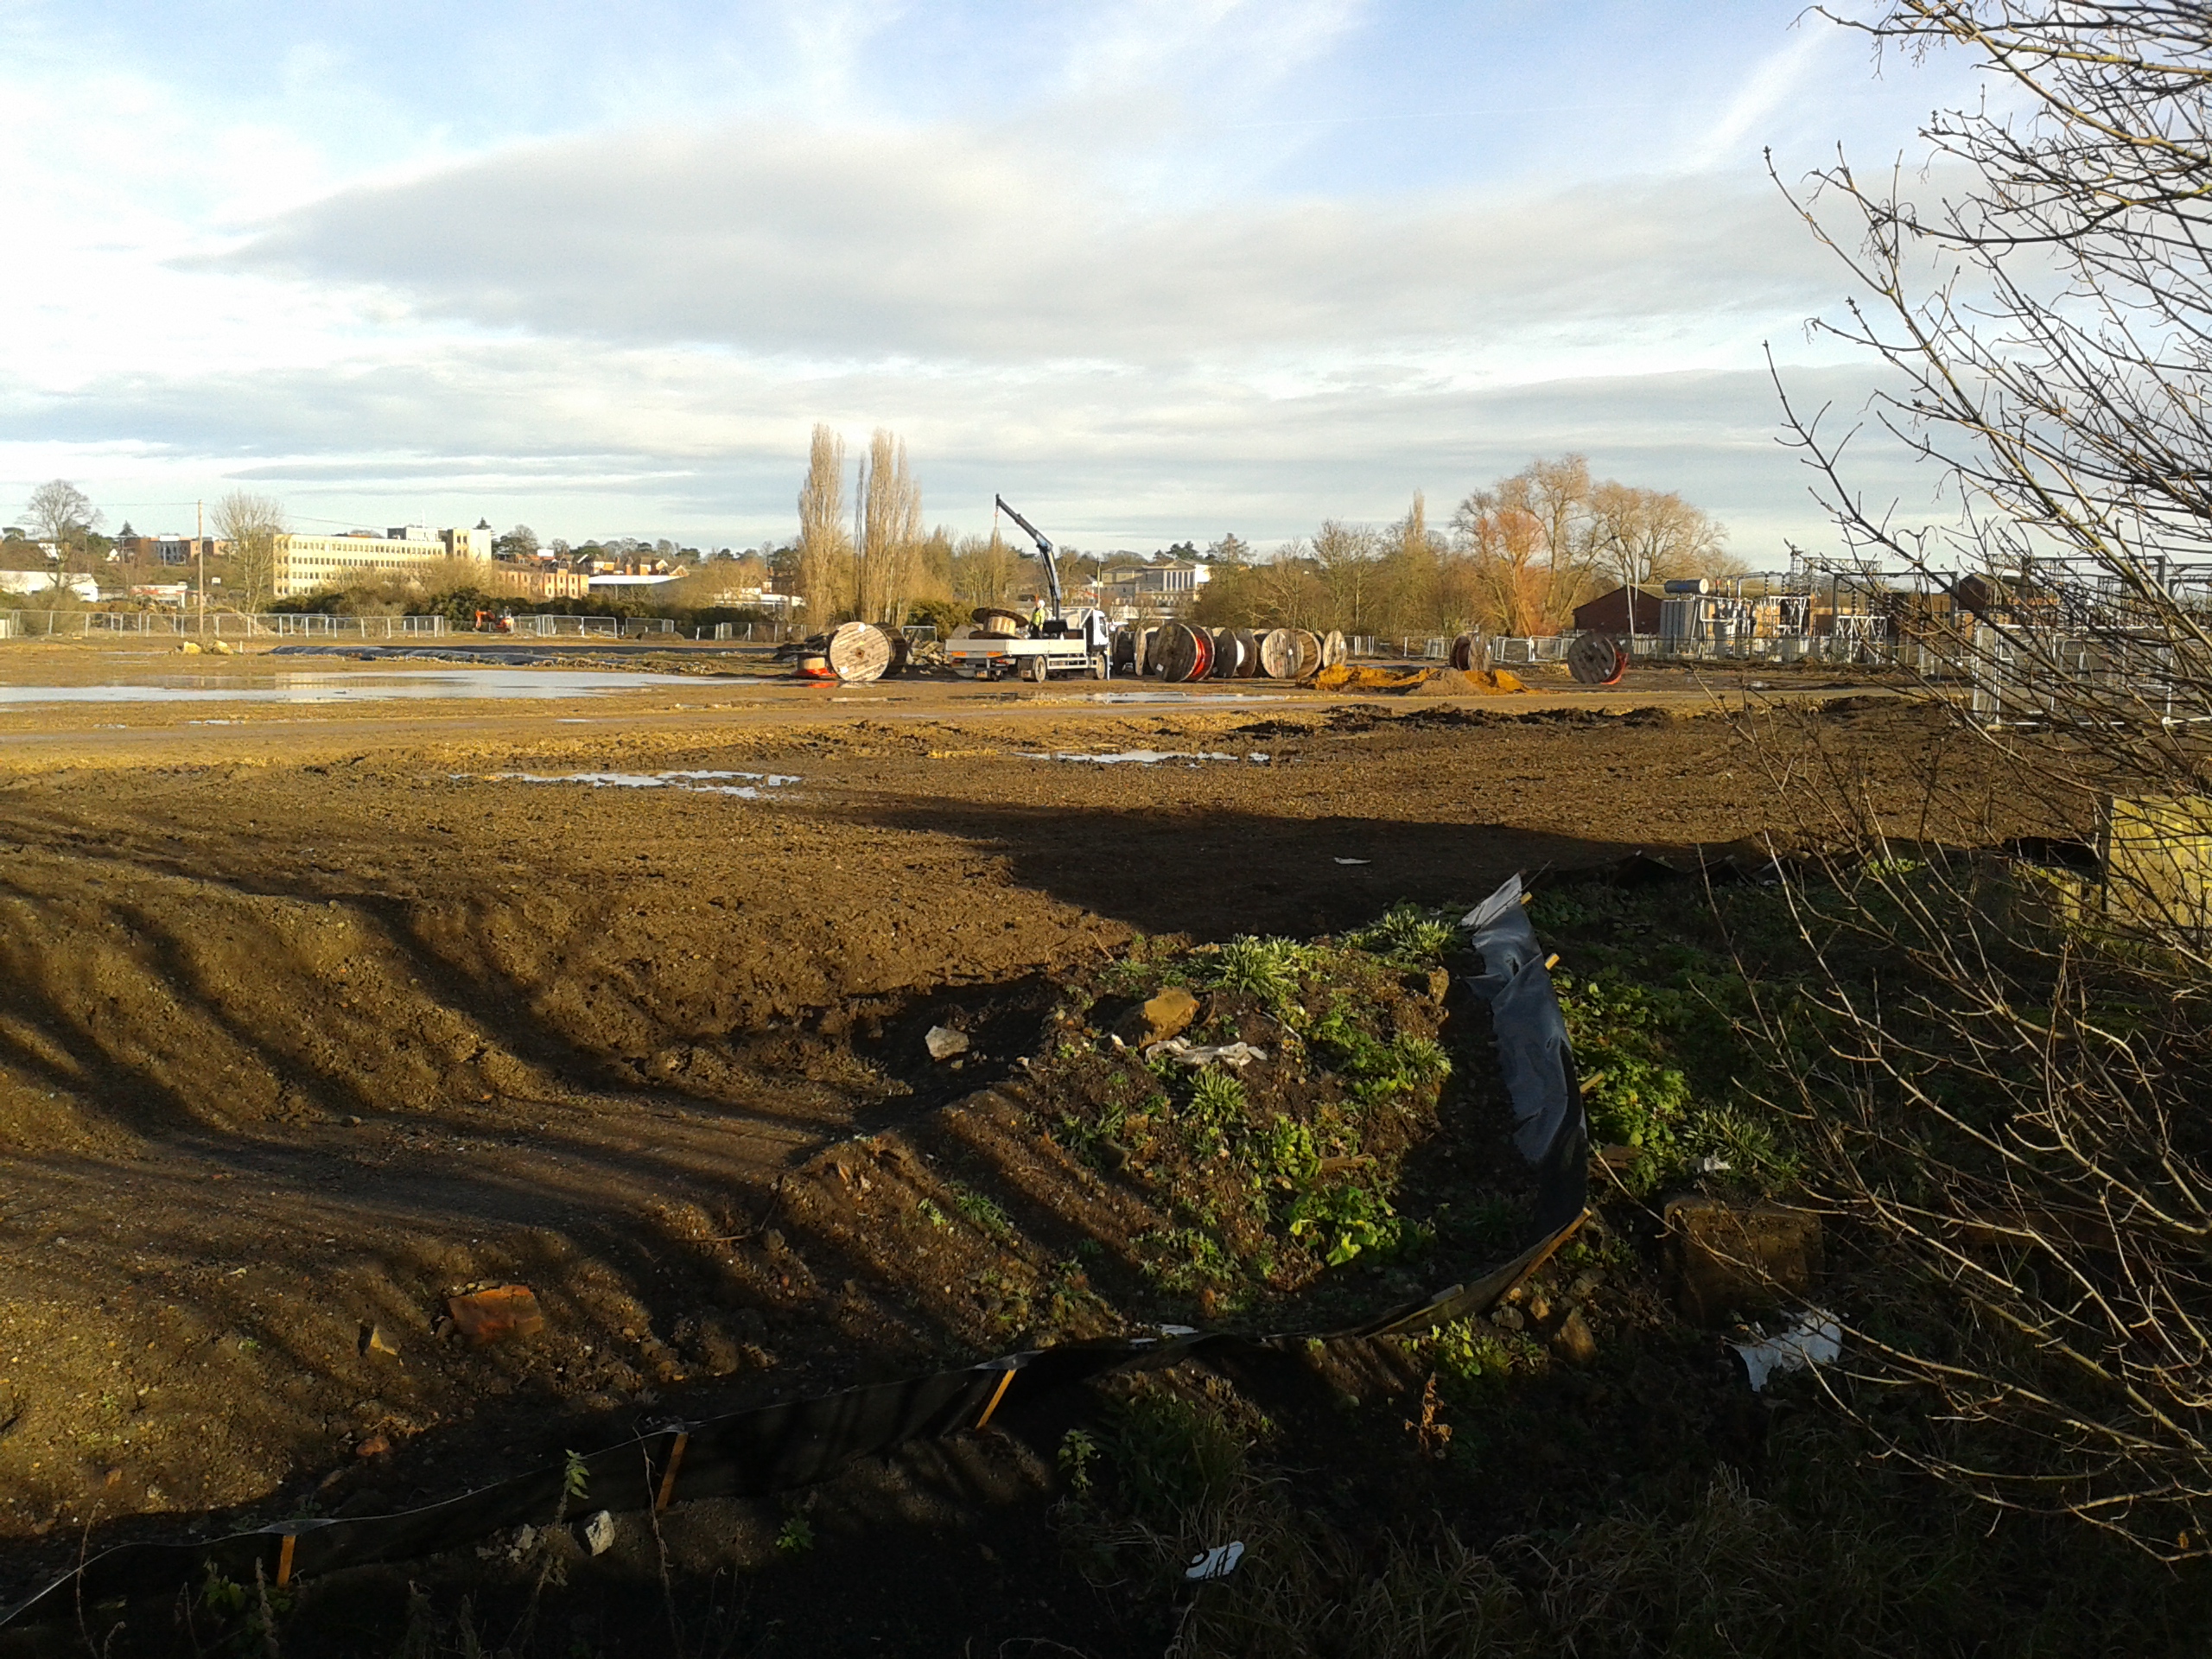
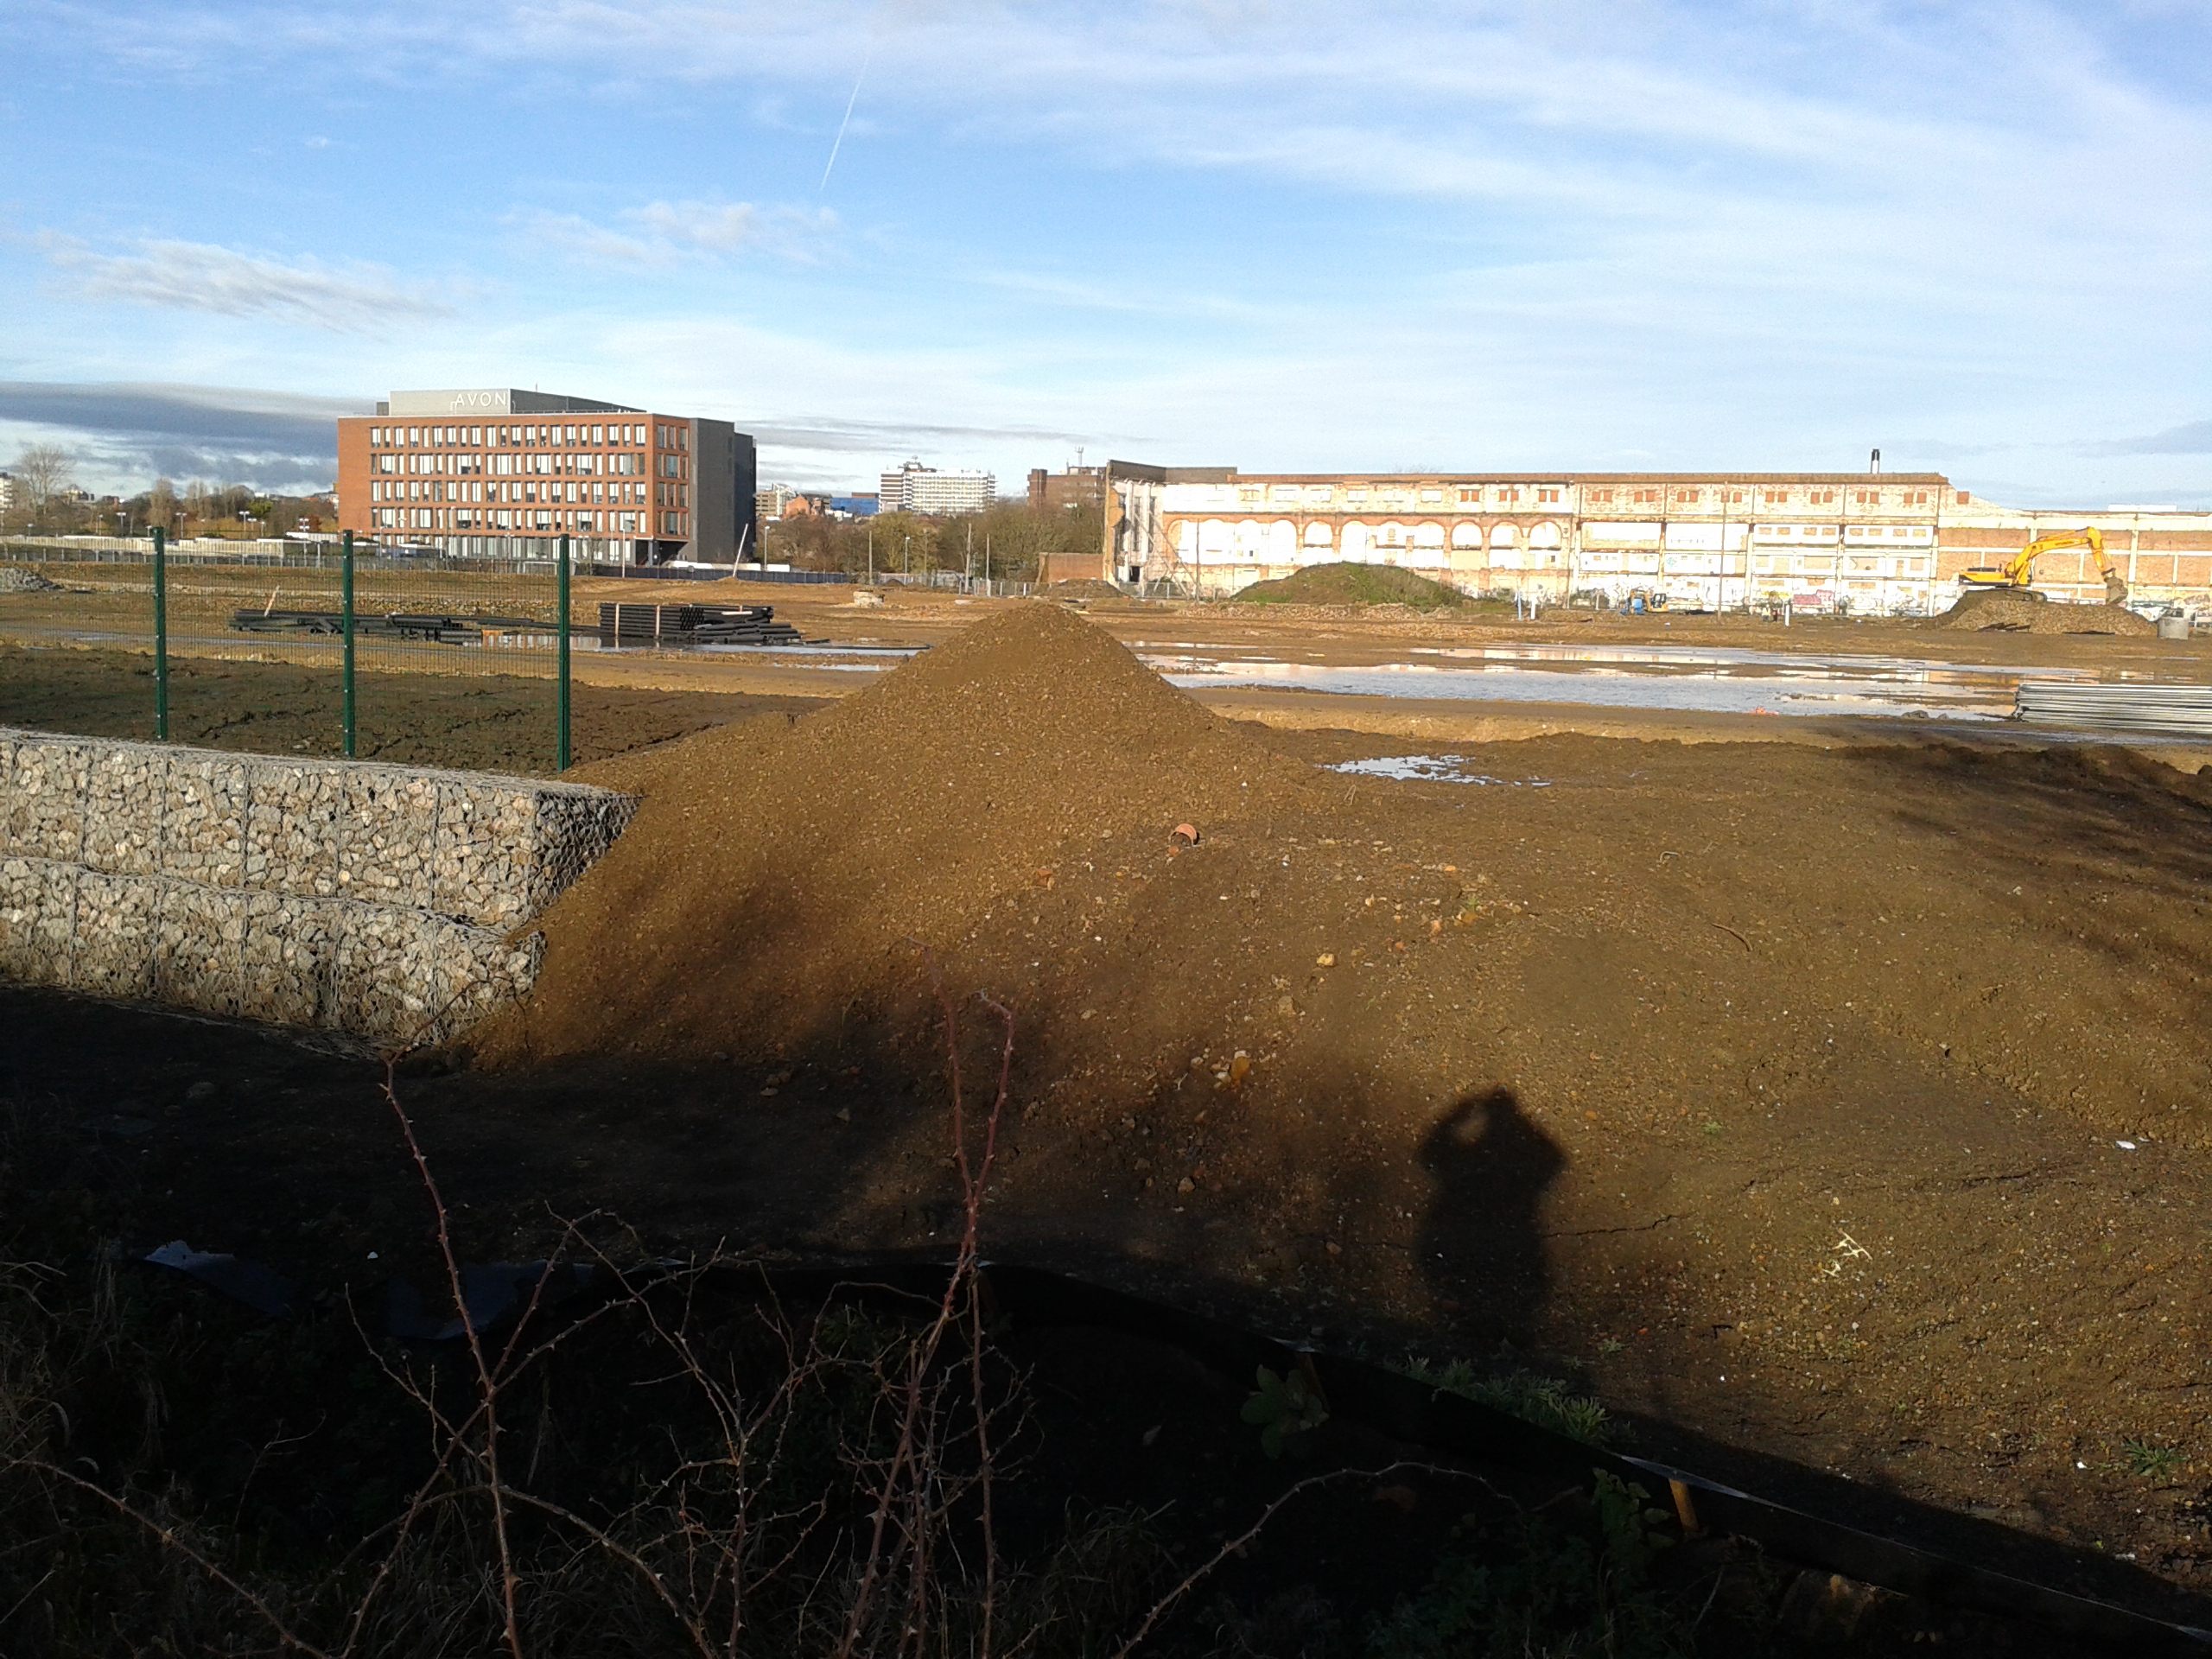
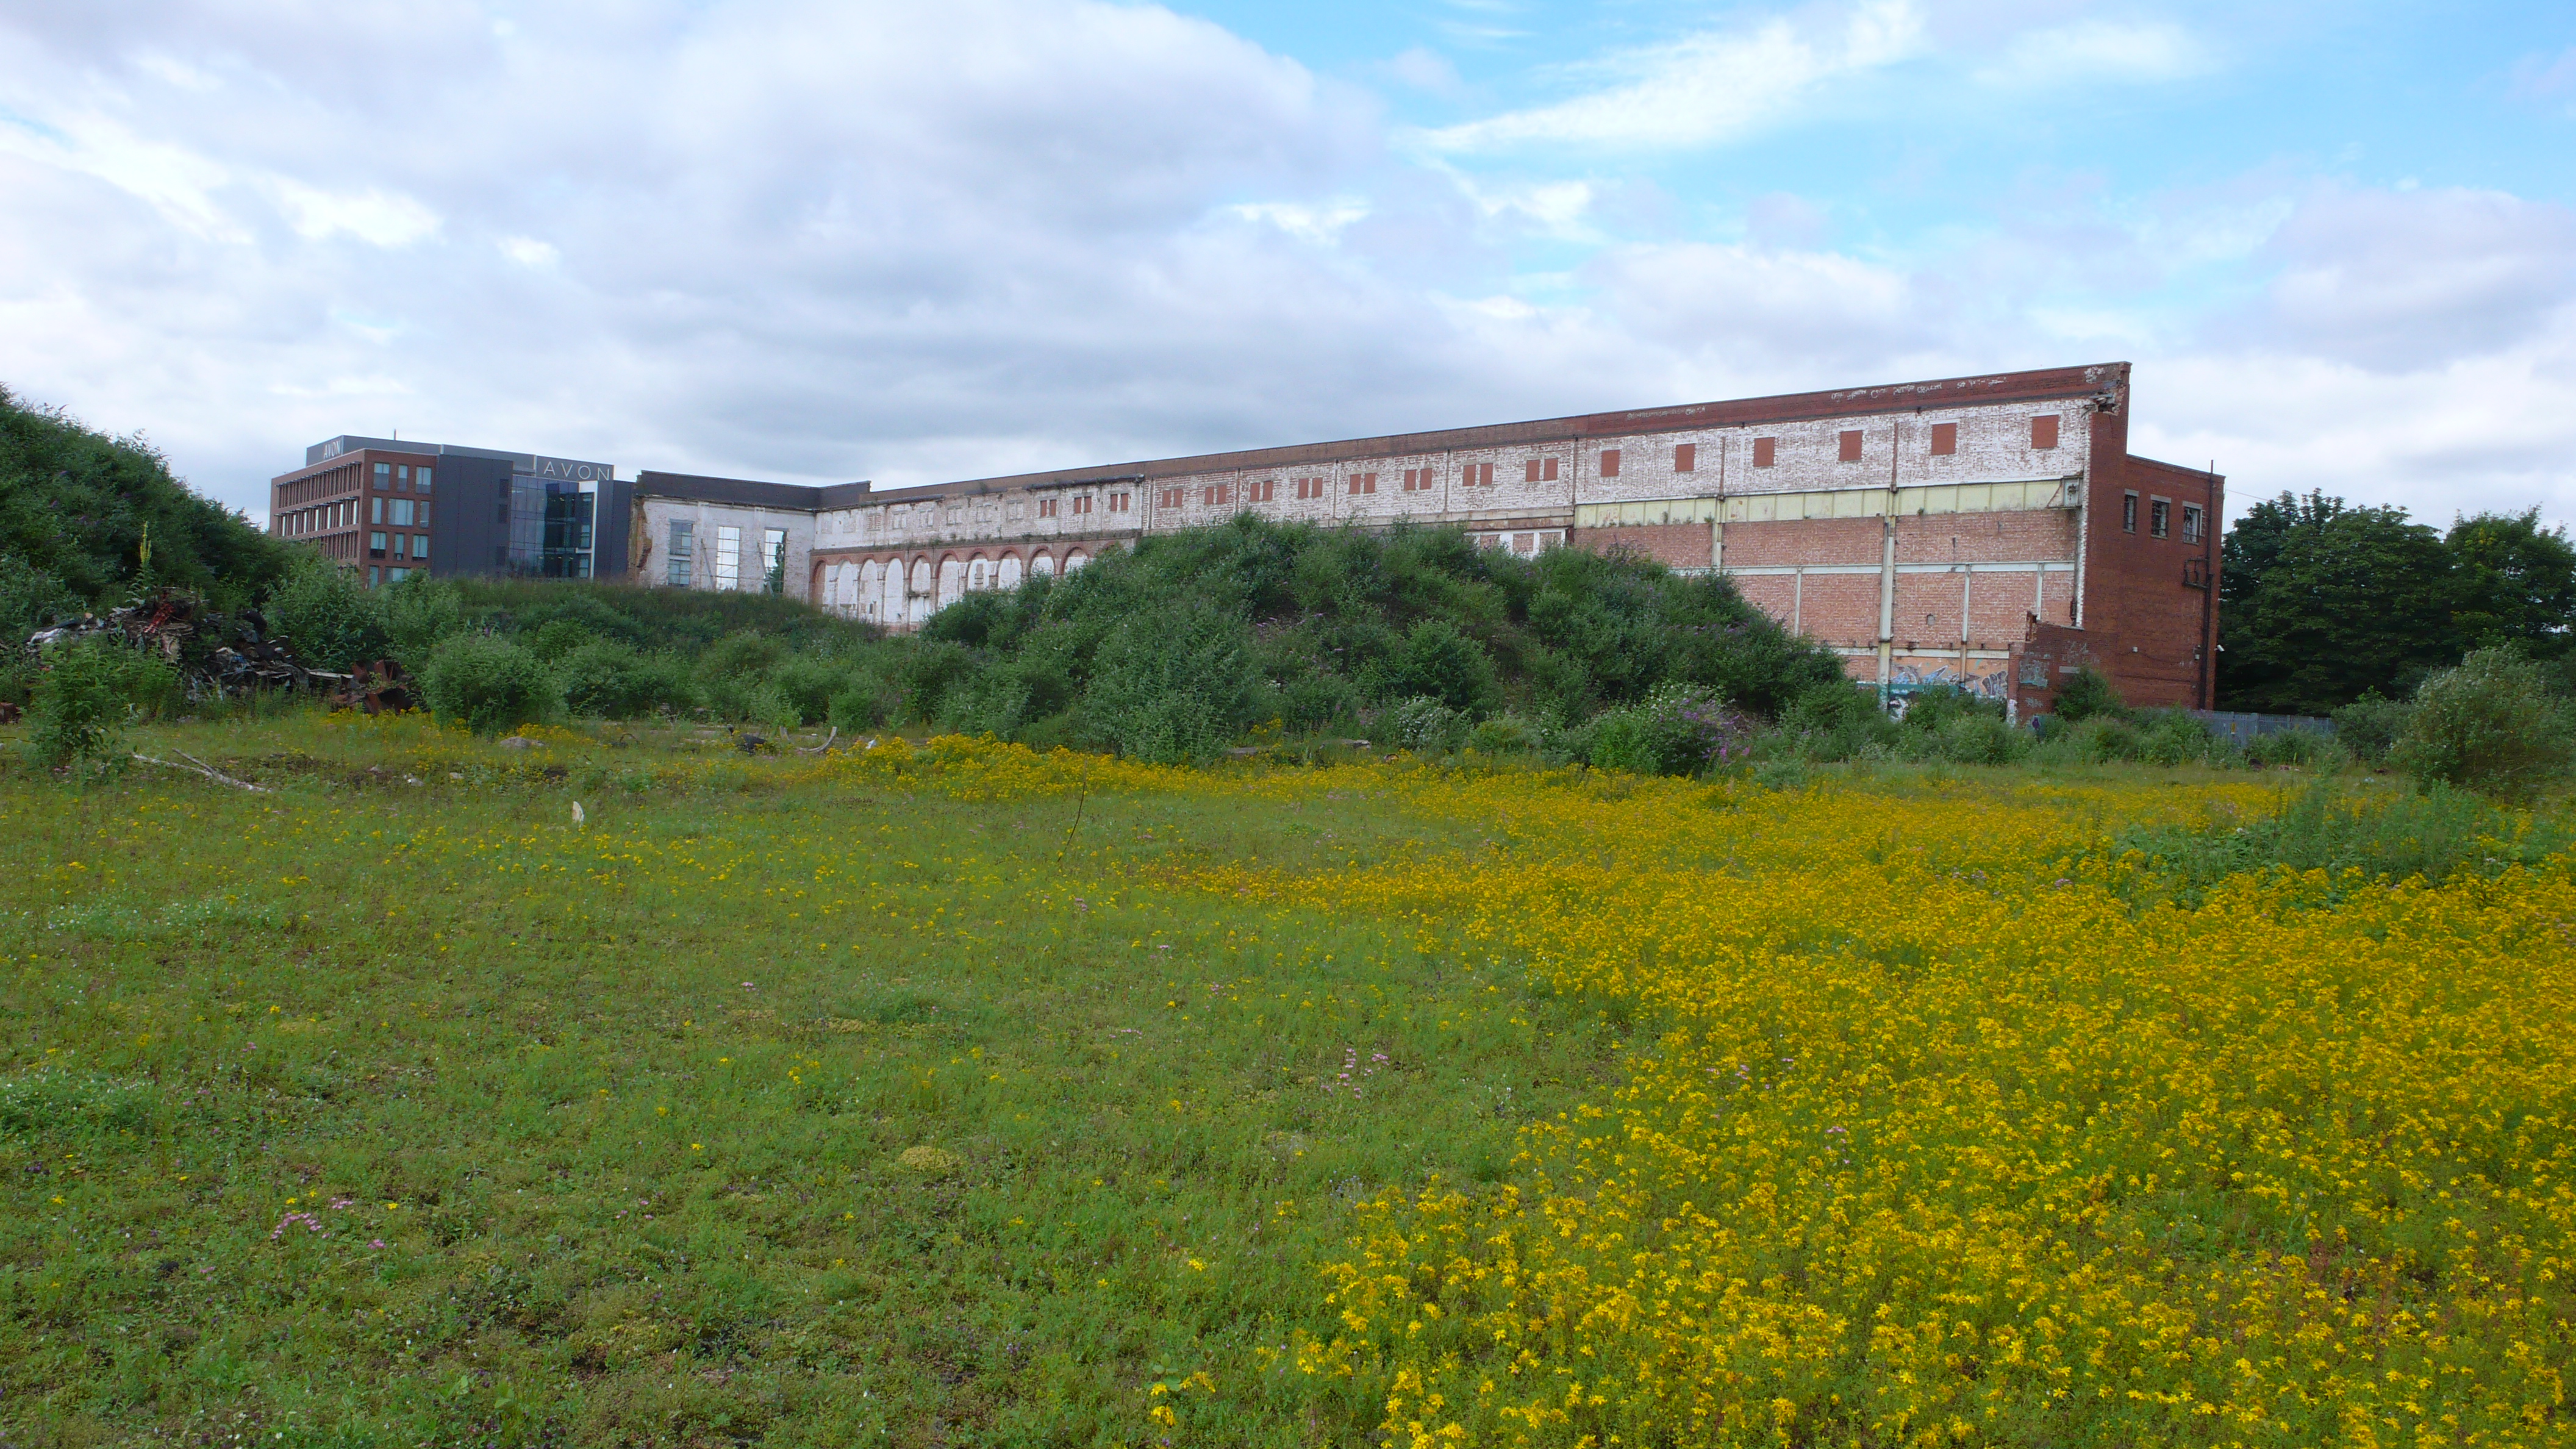
I’ve written before about the University of Northampton’s plans to build the new Waterside Campus on brownfield land close to the River Nene, here and here.  It’s a huge project, likely to cost in excess of £330 million on a site covering about 20 hectares.

As you might imagine, such an ambitious scheme has not been without its controversies and there is much debate within the university about changes to how we work and interact with colleagues and students, provision of teaching and research spaces, etc.  There’s also been much discussion within the town, though the general feeling amongst the public (as far as I perceive it) is that bringing the university closer to the centre of Northampton will provide a much-needed economic boost and add significantly to the town’s life.

But what effect will such a development have on the wildlife in and around this peri-urban site, given that it’s in the middle of the Nene Valley Nature Improvement Area and very close to internationally important bird sites?

Over the past few months, together with my colleague Dr Janet Jackson, I’ve been taking part in meetings with the Waterside project’s landscape architects (LUC), other partners from the NIA project board, and the local Wildlife Trust. We’ve been discussing the current plans for the green infrastructure of the campus and thinking about how these can be enhanced.  It’s been a fascinating process as initial disagreements have been negotiated towards compromises and additions that everyone is happy with, balancing budgetary, function and space restrictions with habitat creation and landscape enhancement.

There’s too much been discussed to give a full account at this stage, and it’s possible that some details will change over time, but  the current Ecology Strategy document produced by LUC shows that there will be more than 10 hectares of habitat creation on the site, including species-rich grassland, woodland patches, brown and green roofs, swales and damp areas, and recreated brownfield habitat.  The latter is particularly exciting and something of an experiment, as much of the (albeit limited) current wildlife interest on the site relates to the brownfield element, including the “urban tundra“.

P1100110

To put the 10 hectares into perspective, the adjacent Wildlife Trust Local Nature Reserve of Barnes Meadow is only 20 hectares in area, so it’s potentially increasing that site by 50%.  It’s rare for academic ecologists such as Janet and myself to be able to influence large building developments, so this has been an exciting opportunity for us to make a contribution that (if all goes to plan) will have a positive effect on biodiversity conservation in the Nene Valley.

But how will we know if the Great Waterside Experiment has been a success and that the biodiversity of the new campus is at least as rich, and preferably richer, in species than it was before building took place?

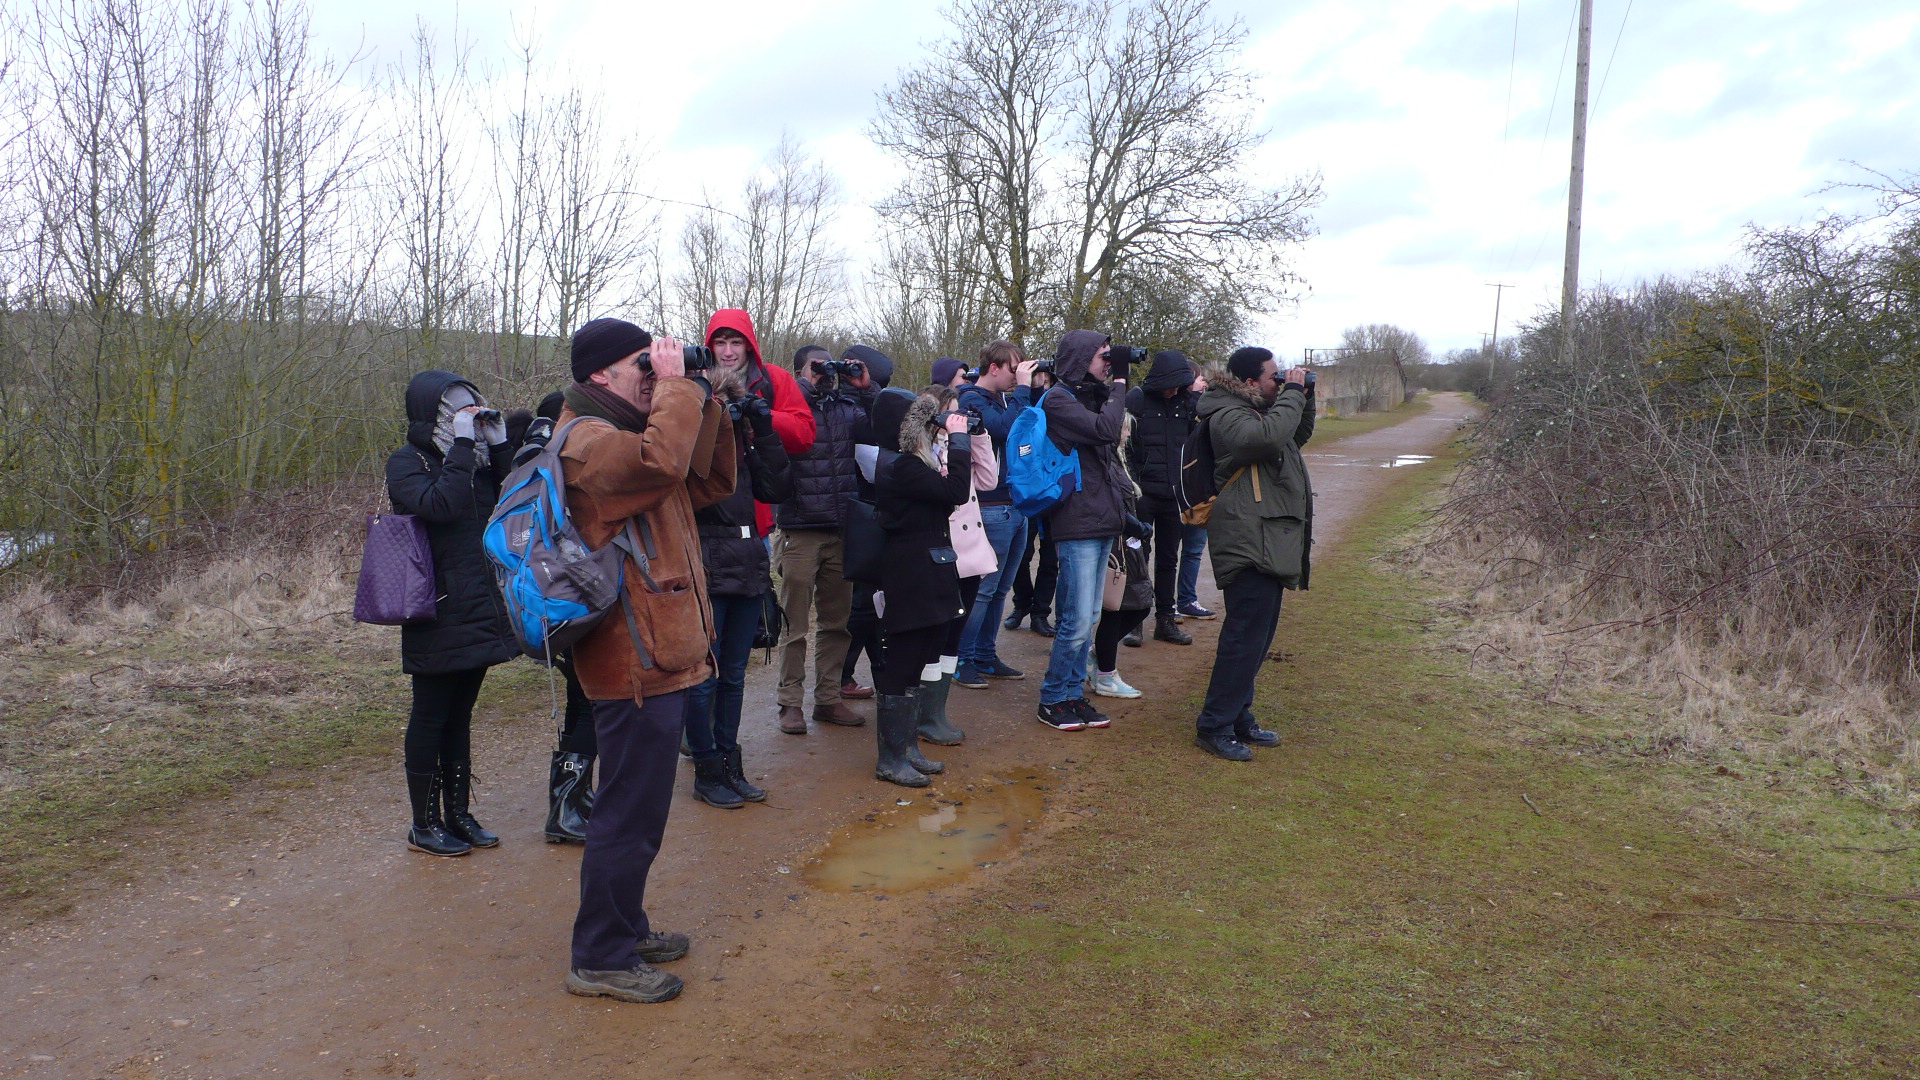
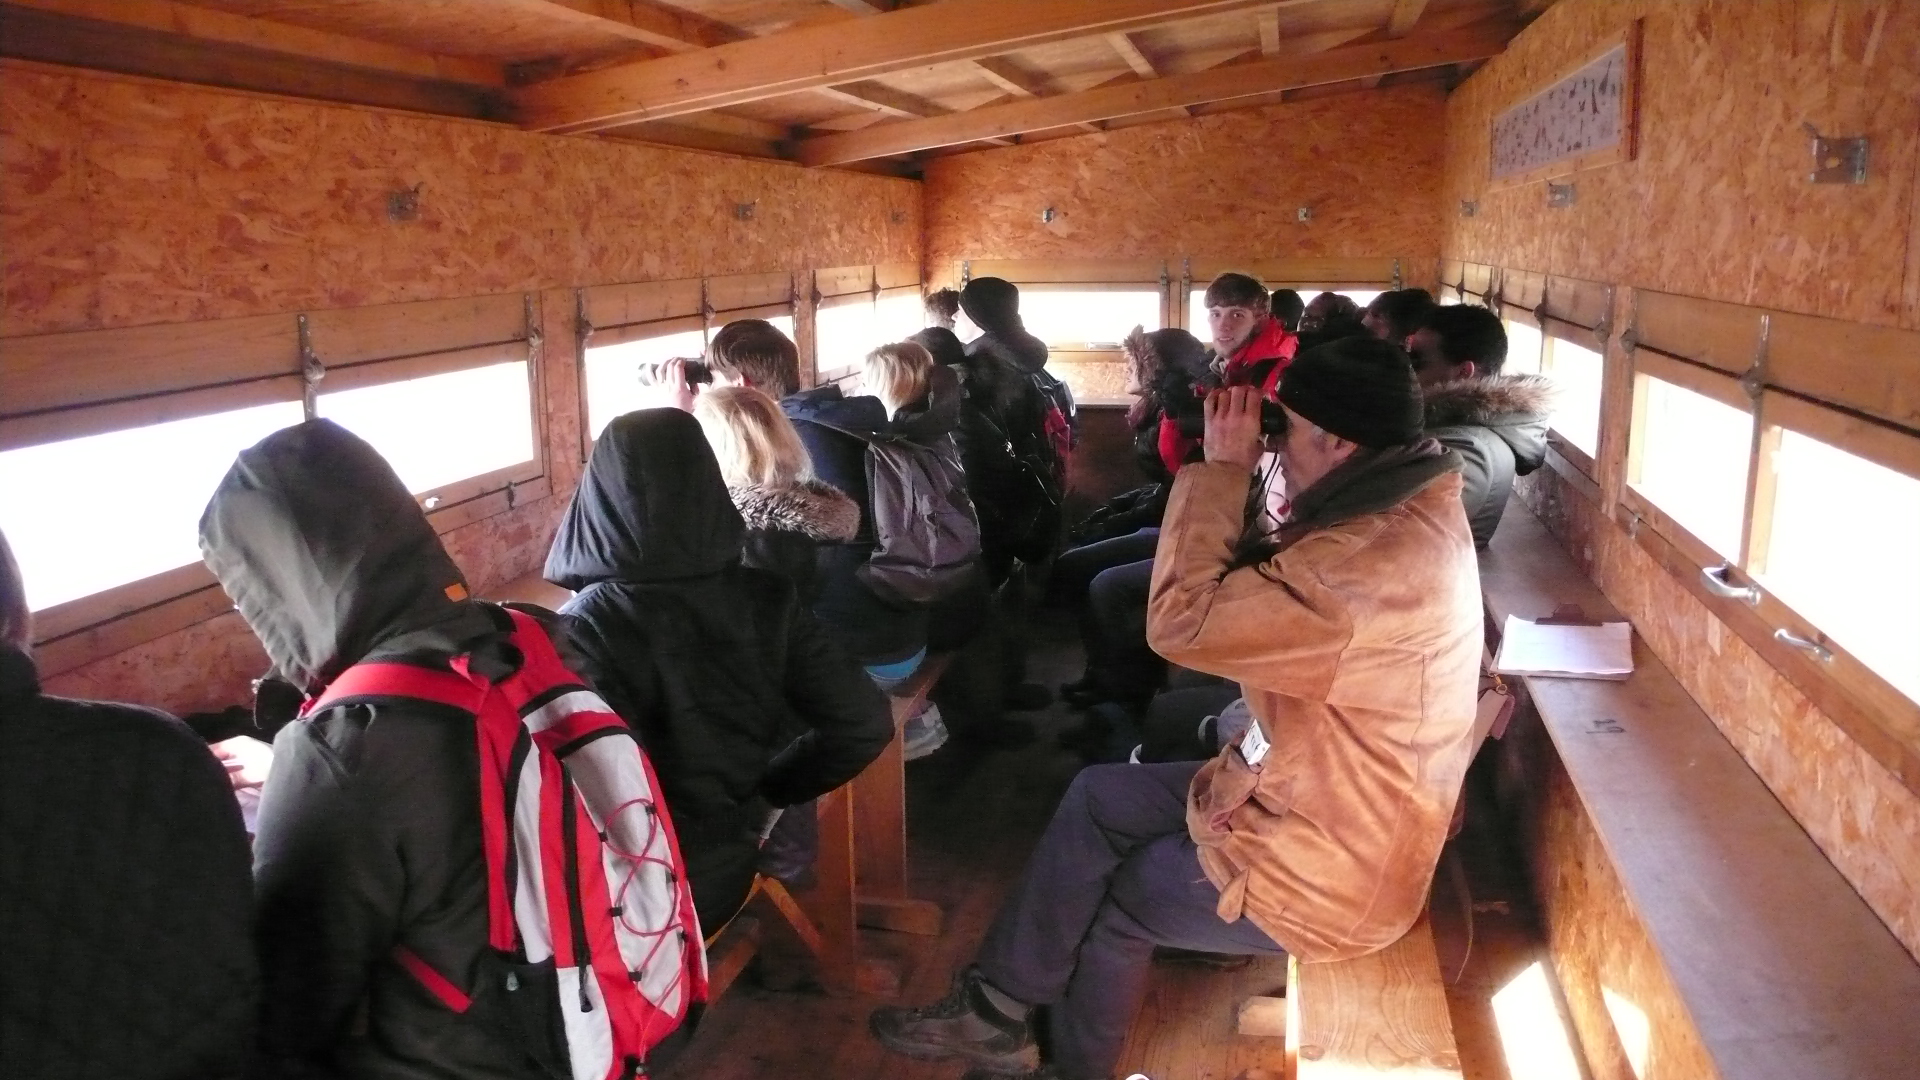
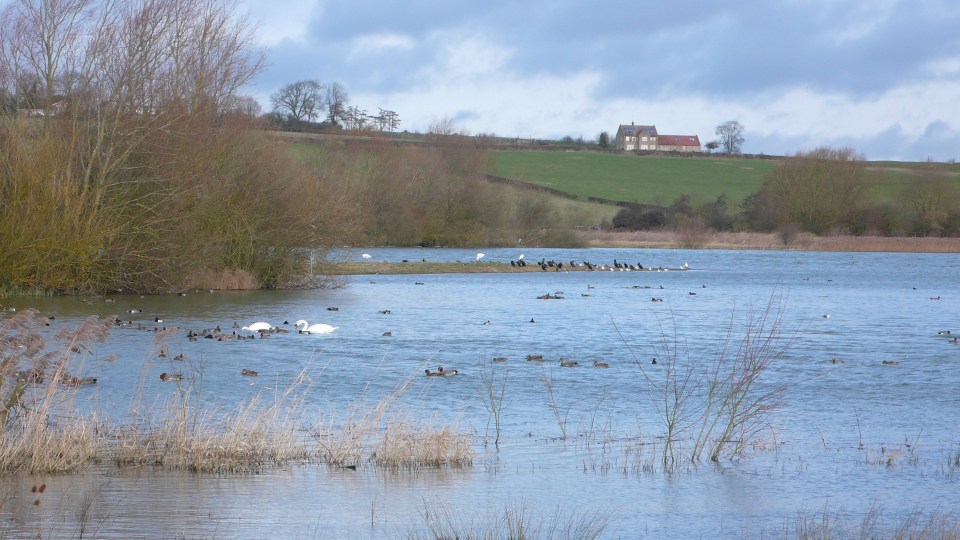
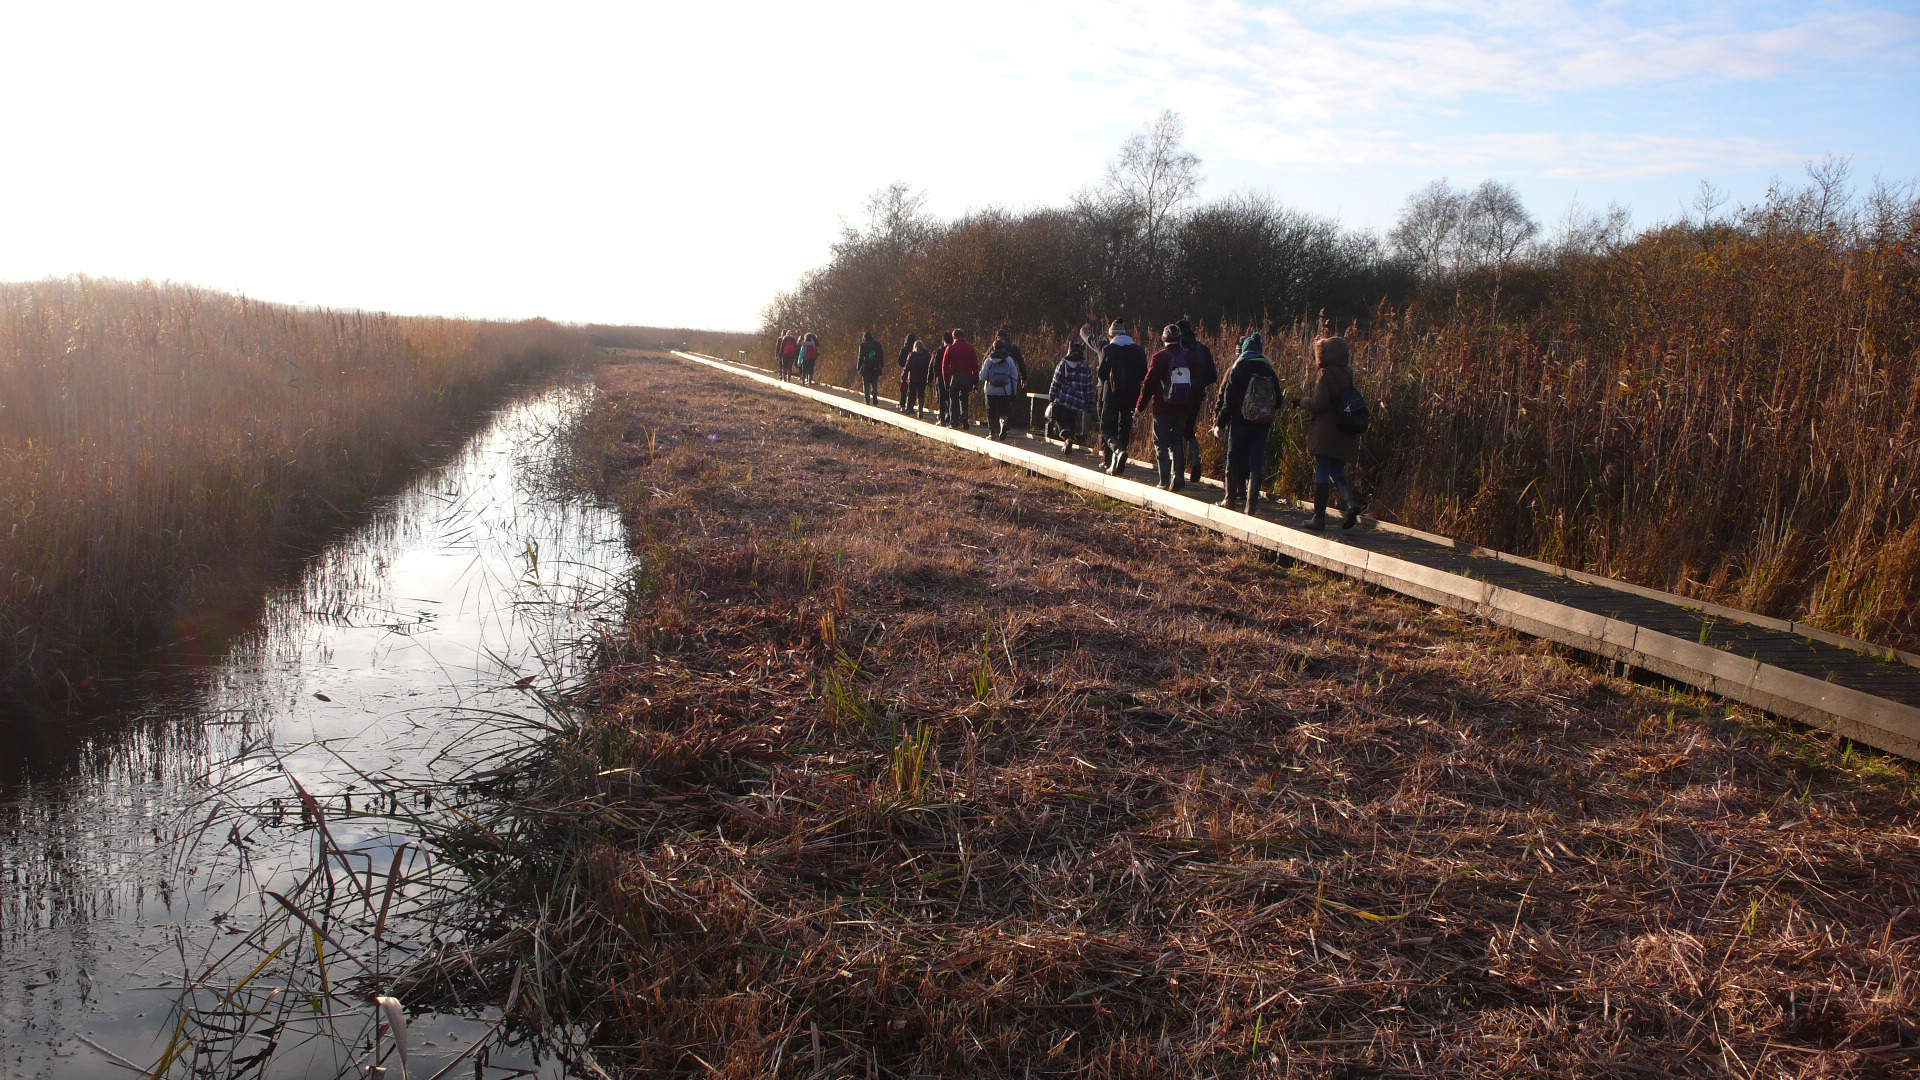
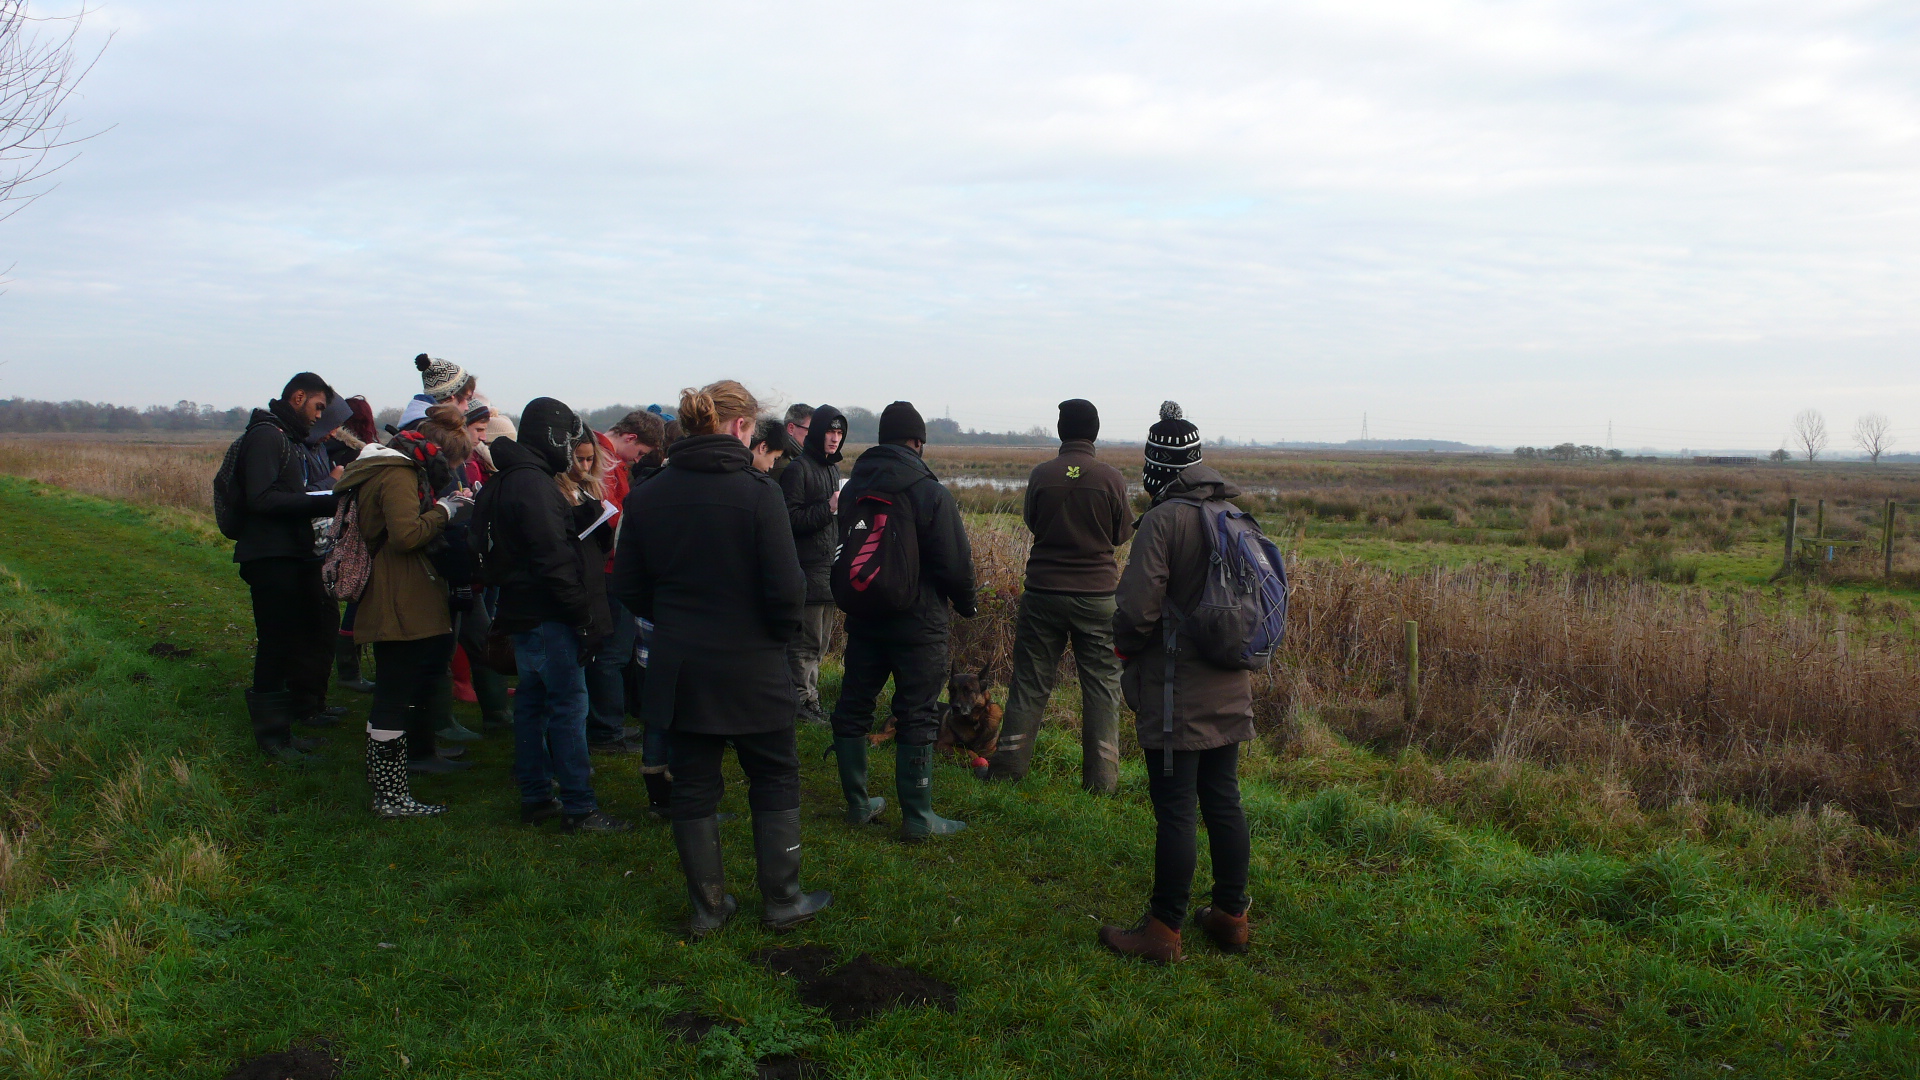
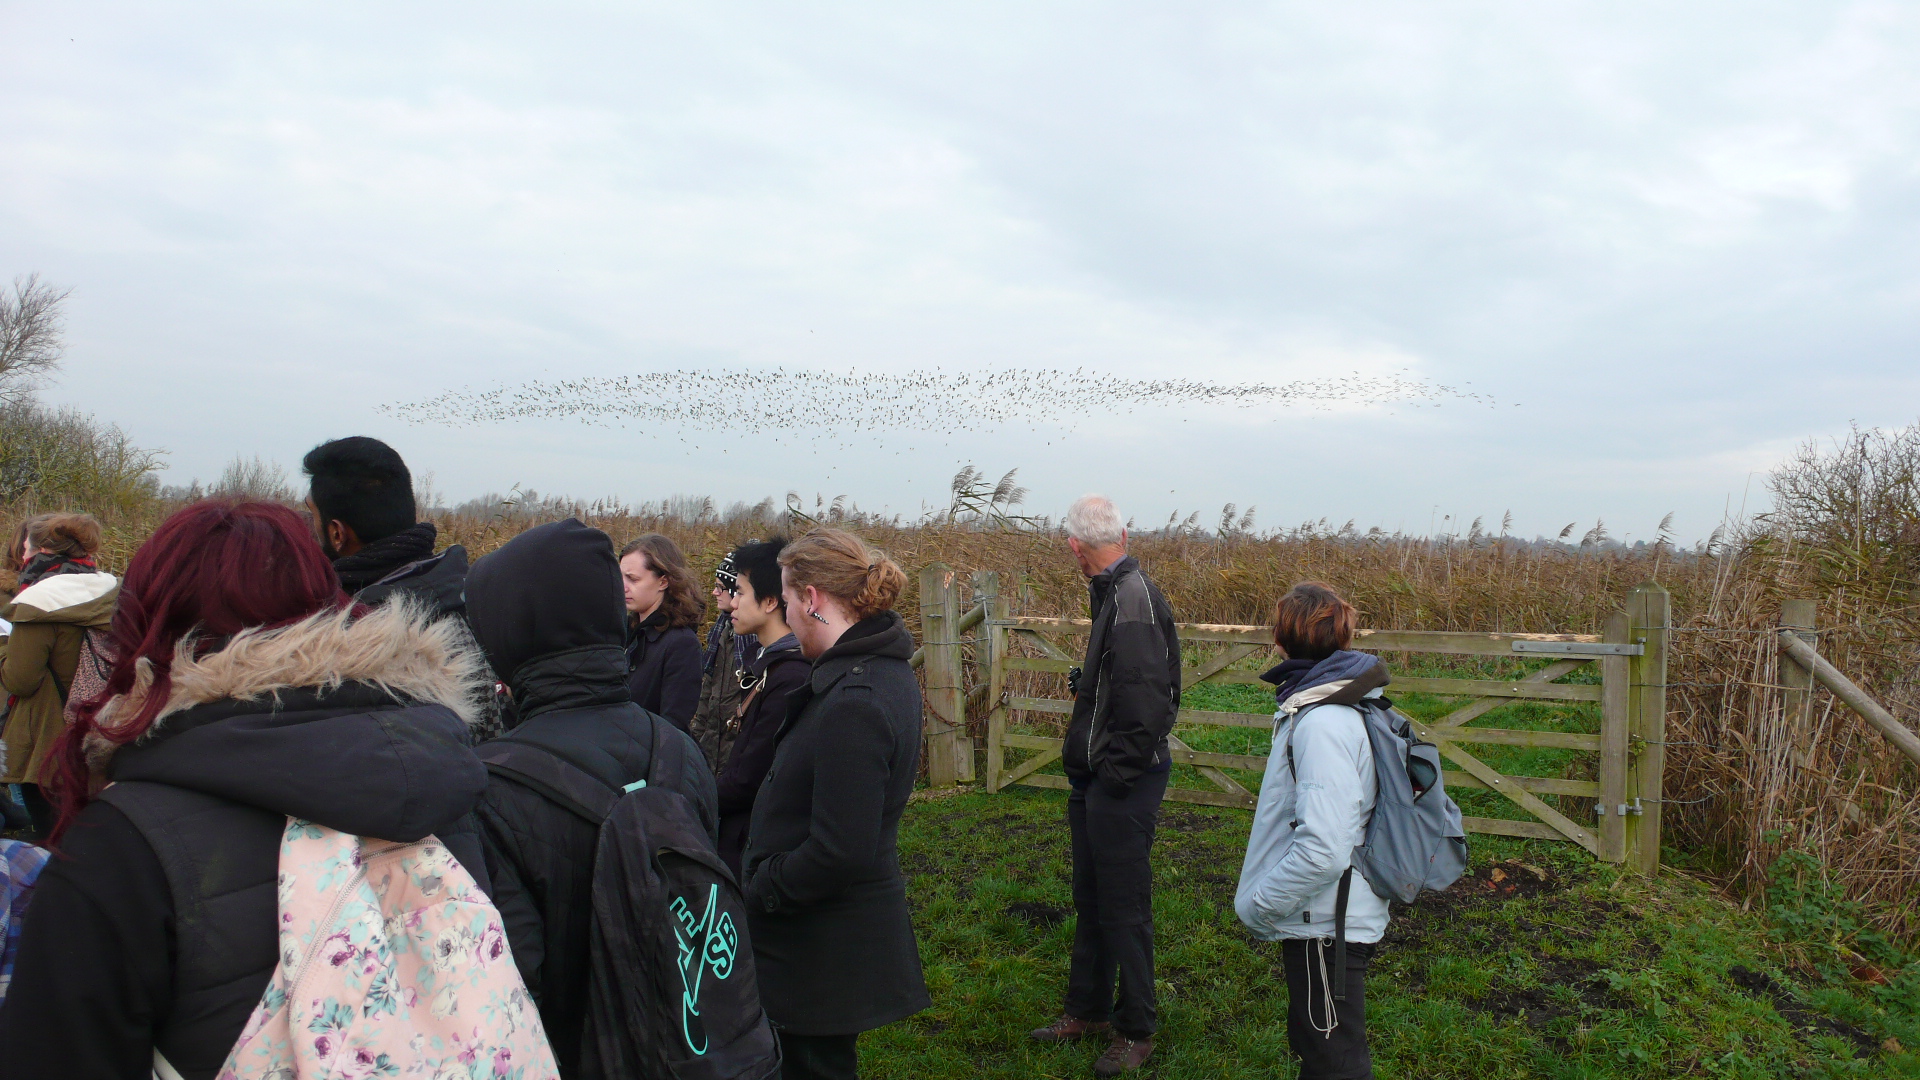
Monitoring of the wildlife is key to this.  Fortunately we have some base-line surveys of birds, plants and invertebrates (including bees and butterflies) from before building started that we can compare with later surveys during and after the campus build.  That process has already started, and with my colleague Dr Duncan McCollin and with two keen second-year students, Jo and Charlie, we have already completed three winter bird surveys to get a sense of how the current site clearance and ground works is affecting the presence of birds in and around the development, including those using the River Nene.  The plan is to continue these surveys up to and after the campus opens in 2018, to give us a data series showing the influence of the campus on bird diversity and numbers.

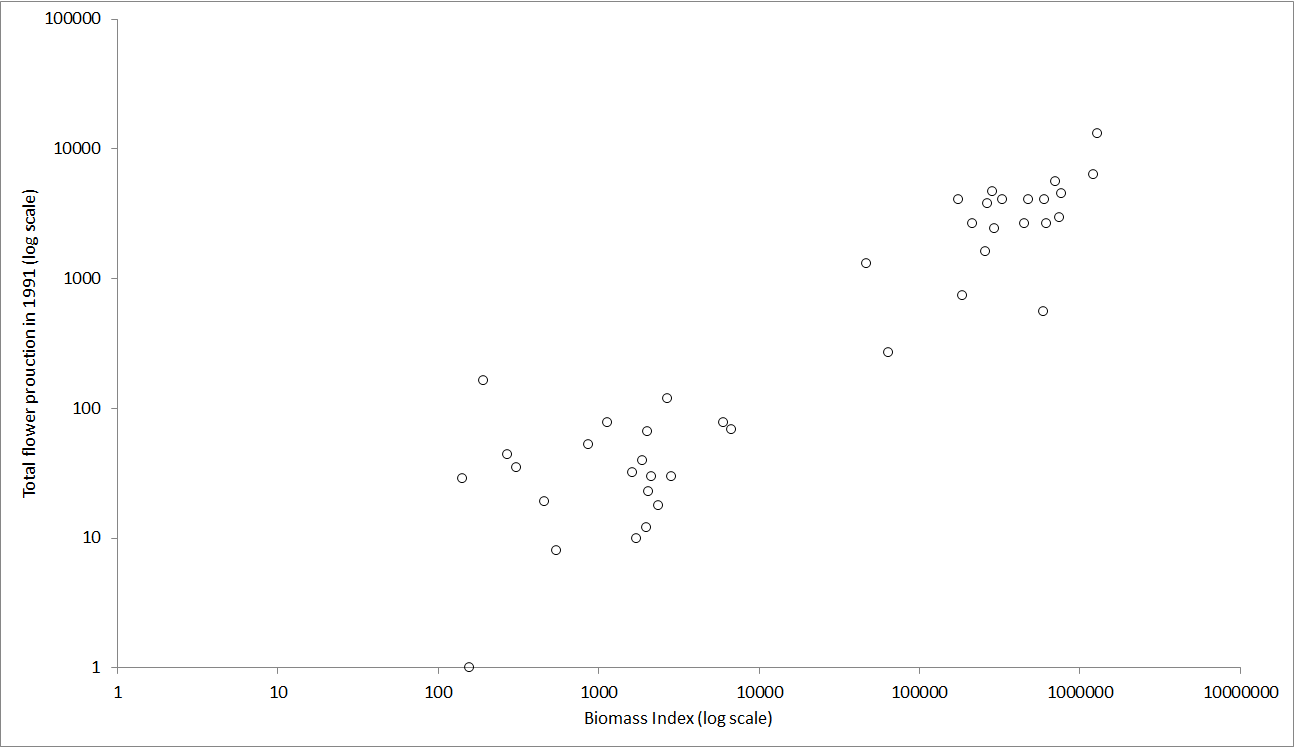
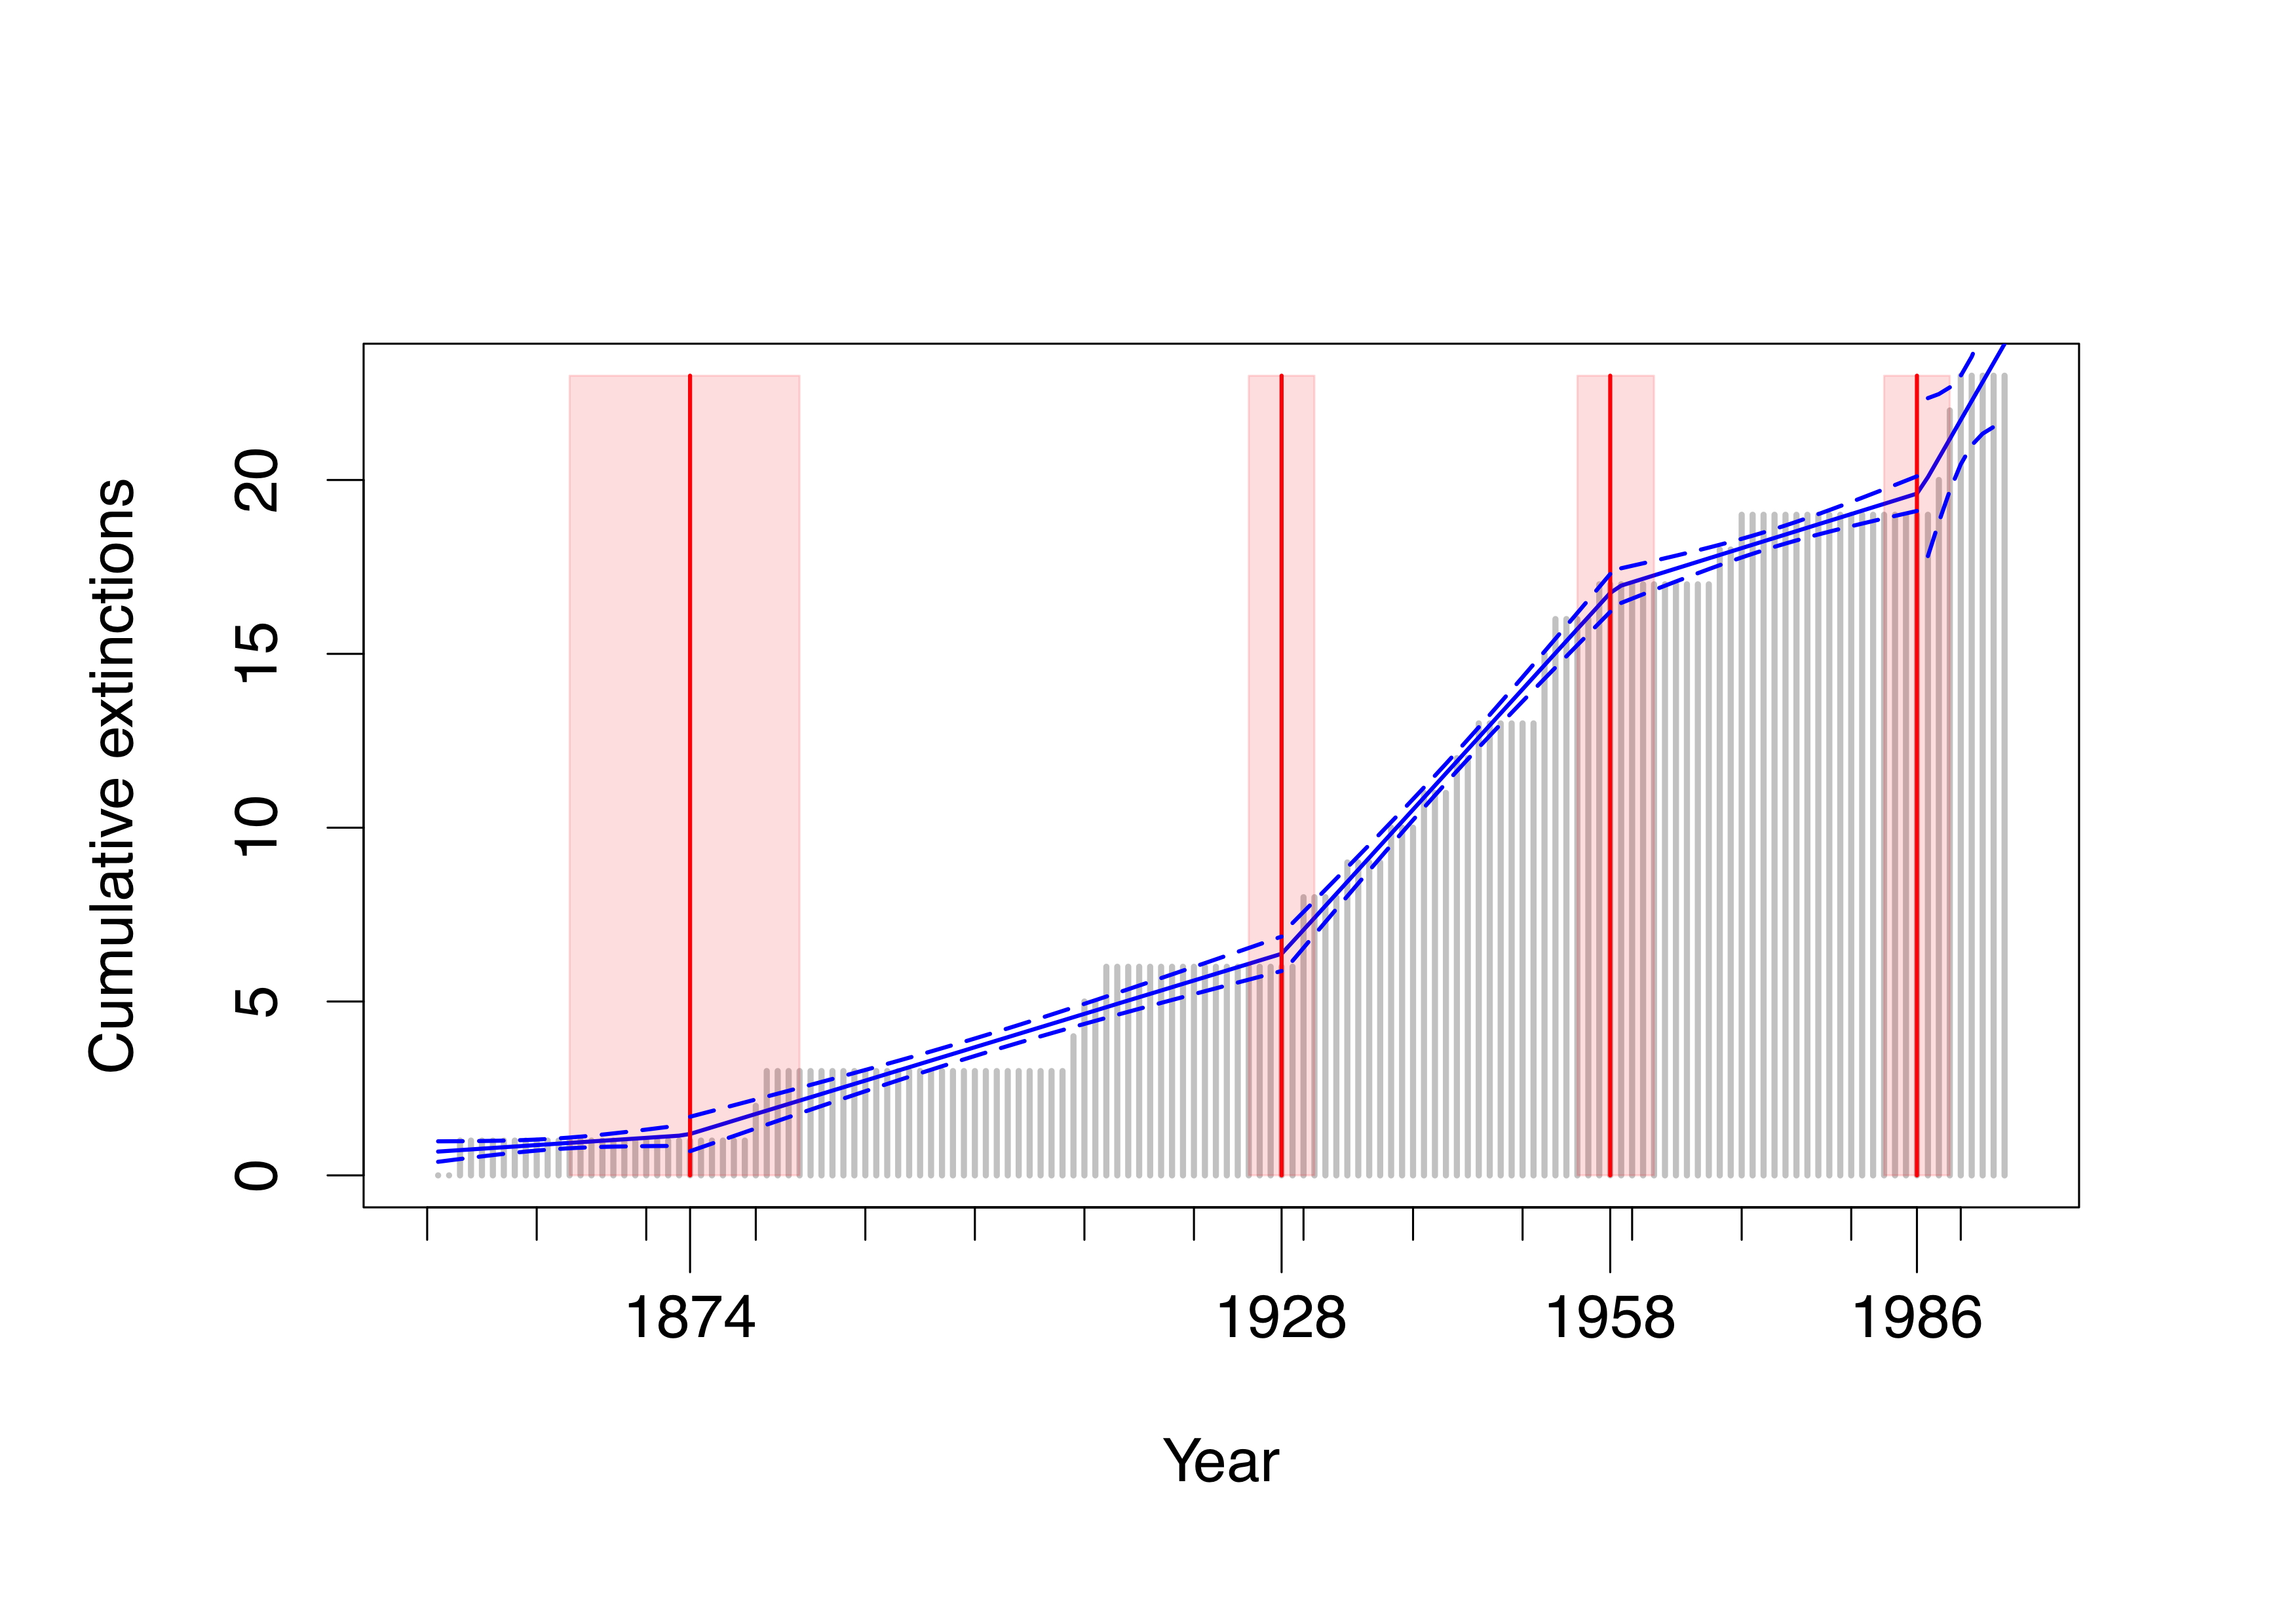
The initial results are currently being analysed and it appears that the current phase of building has reduced overall bird diversity by about 30%, and that red and amber status birds (of most conservation concern) have been affected more than green status birds, as this figure demonstrates (click on it for a closer view):

Waterside bird surveys

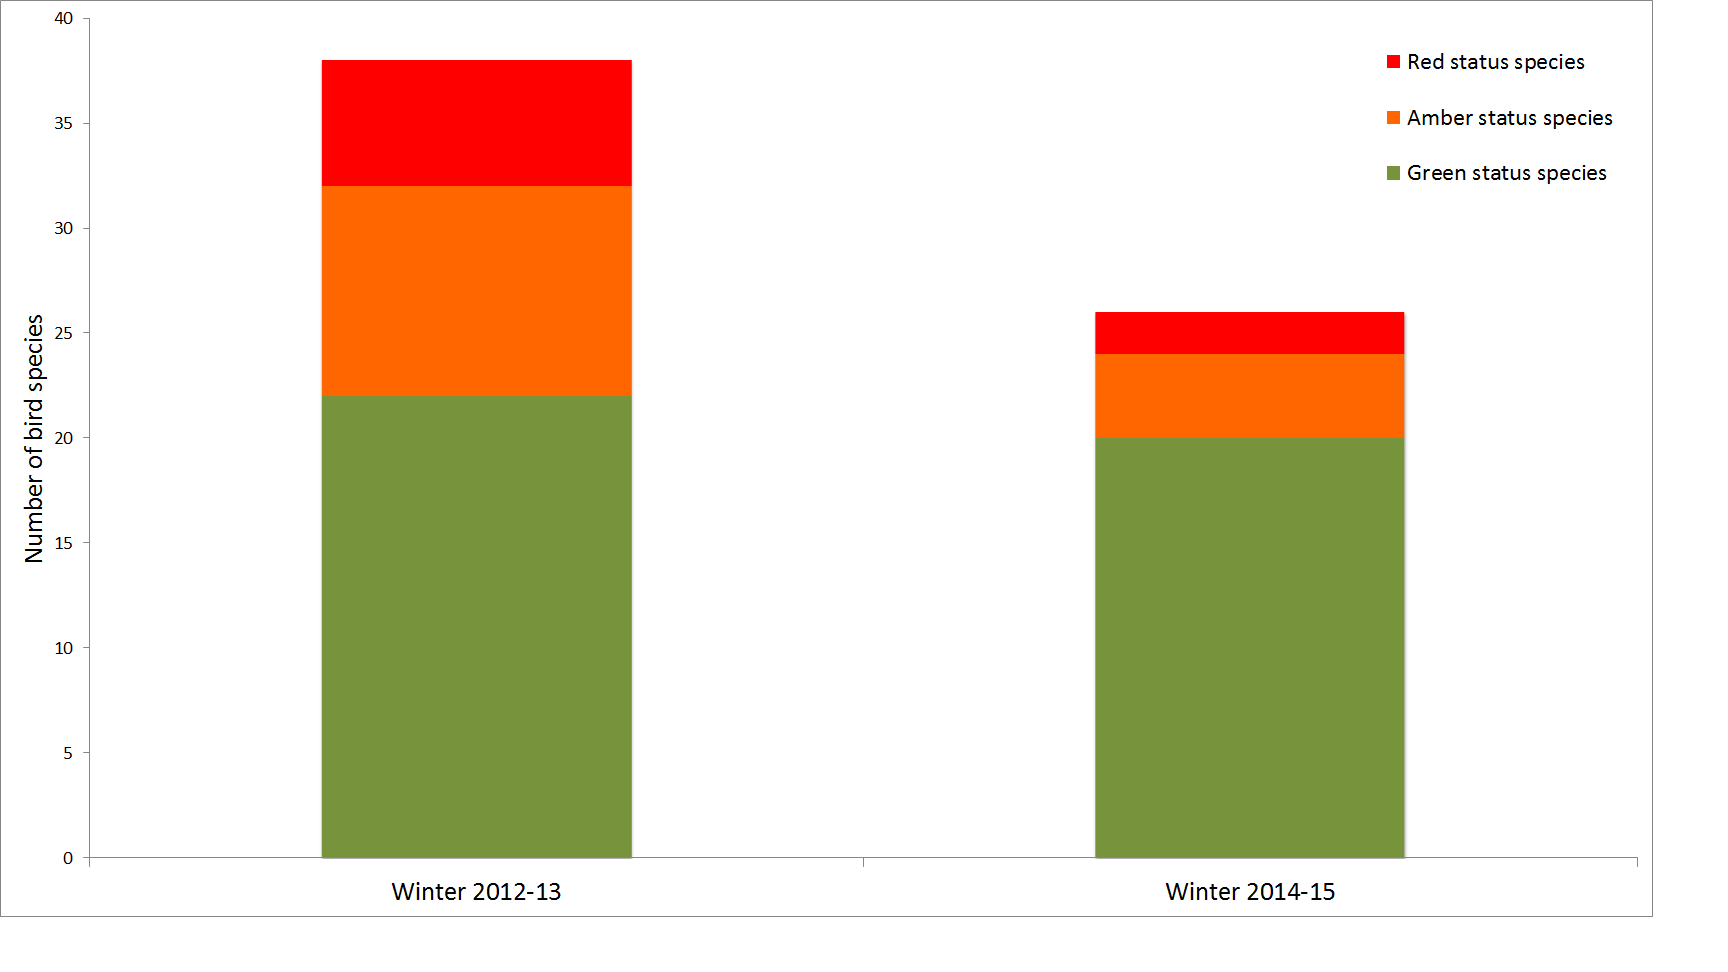
These rough figures hide a lot of detail, however.  For example, there has been some addition of species in 2014-15 that were not recorded in 2012-13, including Coot, Treecreeper and the amber-status Stock dove.  More importantly, some of the amber status birds that we didn’t record on site in 2014-15, we know from additional surveys are still present in habitats within 500 metres of the development, for example Dunnock, Green woodpecker, and Bullfinch.  Similarly, red status birds such as resident Starling, and winter migrant Fieldfare and Redwing occur within at least one kilometre of the site.  Hopefully as the building work progresses towards completion these (and other) species will return, so at the moment we’re not too concerned by their disappearance from the site.

Later in the spring we will conduct a couple of breeding bird surveys, and continue surveying for the next few years until the campus opens in 2018.  Only then will we see exactly how successful our influence has been.  In the mean time I’ll report back as and when we have more data to share.

Waterside winter 2014-15


Clever crows!

Clever crows

Back in October I was staring out of the window of the office that I share with my colleagues, something I often do when I’m pondering a question or trying to add a tick to our “Birds Seen Out of the Window” list*, when I spotted something odd.  A pair of crows had focused their attention on a brown patch of lawn and appeared to be eating the grass.  I’m not much of a birder but I do know enough about crows to realise that grass is not a regular feature of their diet.  The same behaviour was observed a few other times after that, and on other occasions magpies were seen doing the same thing.  What could be going on?

Once I’d taken a closer look at the patch of dead grass the explanation was clear.  During our first year undergraduate induction week about a month earlier there had been a barbeque set up on that spot which had leaked hot fat onto the grass.  What the birds were eating was dead grass coated in lard, a useful source of fat to store for the cold conditions of the oncoming winter.

That’s one of things I love about urban birds such as corvids and gulls: they are adaptable and will exploit any resource that becomes available.  But how had they located the patch of fatty grass?  Were they simply exploring the lawn and stumbled across it by accident?  Seems plausible especially as they often feed on earthworms on the adjacent parkland.  Could they smell it?  The acuity of birds’ sense of smell has been the topic of considerable debate, but that’s certainly a possibility.

I was reminded to post this (originally half-written before Christmas) by a story on the BBC news website this morning about a young girl in the USA who receives gifts from the crows in her garden.  If you’ve not read it, please do: it’s a wonderful example of positive interactions between humans and the rest of biodiversity.

Crows (and other corvids) get a bad press, being often described as “evil” (surely a term that only applies to humans) and blamed for the demise of “nicer” birds – a reputation that is not completely justified, as a recent post on Kaeli Swift’s crow research site demonstrates.

So, learn to appreciate (even love) the crows in your local neighborhood; they will reward you with some entertainment as you watch their behaviour, if not necessarily with gifts.


*currently standing at 19 species and rising every month.

Evolving a naturalist – happy birthday to me!

Jeff in the tee-pee

Somehow, today is my 50th birthday.  So I thought I’d mark it with a short post about my personal evolution as a naturalist and, ultimately, professional scientist.

One of the great things about the internet and social media such as Facebook is that you can make exciting discoveries on a weekly basis.  Recently I found out something that means a lot to me on a very personal level: I discovered that a family* who lived in the same street when I was growing up in Sunderland in the 60s and 70s have digitised some old home movies and made them available on YouTube.  In our digital age in which every phone and camera can capture and share events as they happen, it’s sometimes easy to forget that owning a movie camera in the 60s was quite a rarity and the majority of kids living at that time were never filmed.   

These movies are exciting not just because one of them shows me aged about 5 years (in the blue shirt) playing with friends (I’m there from 3’53”) but because it documents, in colour and moving pictures, one of the reasons why I became a professional naturalist with a deep fascination for biodiversity. 

The grassland in which we are erecting a tee-pee is not some country meadow, the kind of wild rural landscape cited by so many other naturalists as inspiring their childhood fascination with natural history.  These grasslands had arisen spontaneously on cleared demolition sites, following the removal of Victorian terraced housing and tenement blocks, some of which were slums and others that had suffered bomb damage in the Second World War (now that does make me sound old!)

Up until the 1950s this area had been very built up, with the houses, shops and pubs serving the local families who were employed mainly in the shipyards and coal mines to the north of the town.  You can get a sense of how urban it was from this 1898 map of Southwick; the places I refer to are just south-west of The Green to the left of the map. 

Following demolition the sites were left to their own ends, and were colonised by plants, insects, birds and mammals from patches of habitat closer to the river that had either been cleared of buildings earlier in the century, or which had never been built upon at all.  There are some nice areas of magnesian limestone grassland nearby along the higher banks of the River Wear valley, and typical calcicole plants such as Greater Knapweed (Centaurea scabiosa) could be found on these post-demolition grasslands.  In fact, in the absence of horse chestnut trees, we used to play a version of conkers using the unripe seed heads of Greater Knapweed.  Was that an echo of earlier children’s games in Britain, prior to the introduction of horse chestnuts in the 17th century?  Apparently similar games were played with snail shells and hazelnuts.  

If you watch the opening minute of this piece of footage from the same series, and ignore the girls posing and playing in the foreground, the background reveals a rich flora of plants, with butterflies hopping between flowers.  The first bird species that I can remember identifying, and being fascinated by its bright colours, was Goldfinch (Carduelis carduelis) feeding on the seeds of tall thistles in the very area where this was filmed.   The first butterfly that I could put a name to was the Small Tortoiseshell (Aglais urticae), also feeding on thistles, but this time on the nectar-rich flower heads, as a pollinator.  We’d collect its caterpillars from the nearby nettles and raise them in jars.

So you don’t have to have had a rural upbringing to appreciate and benefit from nature, and to later influence your profession and passions, any piece of land can inspire interest in kids, regardless of its origin, if nature is left to colonise. Unmanaged, semi-wild green space within towns and cities has huge value, both for wildlife and for the culture of childhood.  They need to be protected just as much as rural nature reserves, including the generally disparaged but actually biodiverse “brownfield” sites, as Sarah Arnold has discussed in a recent blog post.

Some of the riverside grasslands still remain and I hope that they are fascinating new generations of kids with their colour and diversity and flouncing butterflies. But the post-industrial grasslands on which I played and looked for bugs and flowers are all gone; they were cleared and built upon in a flurry of housing and retail development in the 1980s.  Perhaps in the future they may return if those buildings are themselves demolished and the land allowed to lie undisturbed for a while.  That is what nature does: it ebbs and flows across our landscapes in response to human, and natural, interventions, endlessly changing and endlessly fascinating to the curious minds of children and scientists, no matter how old they are.


*My sincere thanks to the Scrafton family who took the original footage, made it available on YouTube, and gave me permission to use it in this post.

Data I’ll never publish 1: flower production and plant size in Lotus corniculatus

Lotus flower production graph 1991

For reasons that will become obvious next week, I’ve been in a reflective mood recently and this first in an occasional series of posts about “data I will never publish” is one of the results of that reflection.

When scientists have been doing research for a few years, most of them start accumulating a back-log of data.  In some cases this is data that may be published in the future (for ecologists that means long-term data sets, which I’ve talked about before) but other data may be fragmentary or simply too limited to be publishable.  Good data are hard won and I never, ever discard data: you never know when it may come in useful.  So in this series I will present such scraps of data that I know I’ll (probably) never publish.  Their purpose is to illustrate interesting points, to stimulate discussion and ideas, and hopefully they might even be of use to other researchers in one way or another (I’m happy to share the raw data, just drop me a line).

This first data set was collected in the grasslands of Wytham Woods in 1991 when I was a research student.  It subsequently ended up being used in my PhD thesis and in one of the papers that resulted from it (Ollerton & Lack 1998) but not quite in this form, rather embedded within larger analyses.  The graph above (click on it for a more detailed view) shows the relationship between individual plant size (measured using a calibrated non-destructive biomass index that I developed) and total flower production for that year, in the plant species Lotus corniculatus (Fabaceae), commonly known as bird’s-foot trefoil.

This plant is a herbaceous perennial grassland species which can live for quite a long time (at least 50 years).   The data show that plant size and flower production can span 5 orders of magnitude – the maximum number of flowers produced in one year by a single plant in this population was over 13,000, which is astonishing for a low-growing grassland species!

I’ve used this figure in undergraduate lectures as it illustrates several important points about many plants:

  • in theory, there is no upper limit to the potential maximum size of plants.  As long as they have appropriate growing conditions and are not limited by weather or disease or herbivory, they will continue growing.  That’s because they are modular, constructed of iterations of basic units of the plant “body”, and show indeterminate growth.
  • likewise, there is no upper limit to the number of flowers that can be produced because each modular unit can itself produce one or more flowers.
  • plants can be very plastic in their response to the environment.  The data form two clusters; the lower one (smaller plants) is from a sub-population that grew in a grassland that had never been fertilised.  The upper cluster (larger plants) grew in an adjacent area that had previously been an arable field and in which there were still fertiliser residues present in the soil.  The smaller plants are likely to have been older than the larger plants, but the latter had more soil nutrients on which to draw.

The following graph illustrates the same plants but this time it’s the relationship between biomass and number of seed pods produced.  Still a linear relationship with no sign of a plateau; female reproduction in these plants just goes on and on (as, of course, does male function via pollen dispersal.

Lotus seed pod production graph 1991

This is one of the things that I love about plants: they are so flexible in their response to growing conditions!

Student field trip to Summer Leys Nature Reserve – birds, bins and biting winds!

2015-01-29 12.38.19

Field trips are a vital component of any university degree course that includes within it elements of ecology, organismal biology, geography or environmental science.  Learning about the natural environment via lectures, books and seminars is one thing: experiencing it first hand is quite another, and adds significantly to a deeper understanding of complex environmental issues such as nature reserve management.  For that reason at the University of Northampton we’ve always strove to maintain as much field experience as possible within our degree programmes, including long field courses to the South-West USA and Tenerife (as I’ve previously documented), day trips to places such as Wicken Fen, and shorter sessions in and around our campus.

An annual winter visit to Summer Leys Nature Reserve has been a feature of our first year undergraduate teaching for many years, and focuses on the bird life to be found in this flooded and restored gravel pit.  Of particular interest at this time of year are the over-wintering waders and wild fowl, for which the reserve has been designated Site of Special Scientific Interest and Special Protected Area status.  The latter is a European-level designation which reflects the international importance of the Nene Valley for bird life.

This year’s trip took place on Thursday, which was initially bright but cold.  The field trip is not compulsory so many students decided not to turn up.  Those that attended had a great time walking the circuit around the reserve, visiting the bird hides, and learning the intricacies of both duck identification and how a site such as this is managed.

2015-01-29 11.34.23

As we walked and recorded I kept a running total of the birds that we identified. Highlights included three Great White Egrets standing together on one of the islands, the greatest number I’ve seen at one time in the county, and an indication of much more common these spectacular birds have become in the last decade, as county bird recorder Mike Alibone has discussed on his blog.  They have bred in Somerset since 2012 and hopefully will do so in the Nene Valley in the not too distant future    You can just make out the birds in the centre of this image:

2015-01-29 11.31.19

Another highlight was the large number of Bullfinches that we saw foraging along the paths and in the low trees, at least 20, all of which were females.  Some were very confiding and we could approach them to within a couple of metres, such as this one:

2015-01-29 11.23.03

Ducks were plentiful, with good numbers of Wigeon, Gadwall, Tufted Duck and Mallard, fewer Shoveler, a couple of Goldeneye, and a single Pochard.  There were also large flocks of Lapwing and a couple of unidentified waders, possibly Redshank.

2015-01-29 12.37.47

The final total of birds was a respectable 39 species and our half-day trip ended as cold winds brought in heavy cloud, rain and then finally a sudden fall of snow. By which time we were back in the warmth of the campus, enjoying a cup of tea and catching up with emails.


Did you remember to thank the insects for Christmas?

2013-12-23 11.44.27

This year I decided not to re-post my traditional “Thank the insects for Christmas” piece, in part because I don’t want to bore the good readers of this blog with too much repetition, but also because the idea has been taken up by the Urban Pollinators Project at the University of Bristol, and developed into an infographic (on which I advised) that you can view here.  The BBC News Website used the information for a nice article called “The insects that made Christmas“.  So look back on your Christmas dinner, if you had one, and give thanks to the many invertebrates that made it happen!

The other reason for not doing a full re-post of that piece is that I was feeling worn out by a long university term that ended not with a whimper, but a stressful double-bang of publication of our pollinator extinctions paper (and the associated media interest, which I may talk about early in 2015) and the release of the results of the Research Excellence Framework, which I coordinated for my department.  We were pleased with the outcome, with over 40% of our research papers rated as “world leading” or “internationally excellent”, and most of the rest being “recognised internationally”.  For a young, mainly teaching-focused, non research-intensive institution such as the University of Northampton (which doesn’t enjoy the facilities and funding of older, larger universities), that’s an impressive result.

A final bit of news is that this blog made it onto the MySciBlog survey 2014, by Paige Brown Jarreau (Louisiana State University) who asked more than 600 science bloggers “to list up to the top three science blogs, other than their own, that they read on a regular basis”.  The initial results can be found at Figshare, and I’ve inserted network graphic below (click on it for a larger view).  The size of a node is proportional to the number of respondents who read that blog regularly and my blog is part of the green section near the top, tucked just under the dominant Dynamic Ecology.  It’s gratifying to know that other bloggers are reading this in significant numbers!

Thanks to everyone who has read my blog over the past year, particularly those who have commented on the ideas and information I’ve presented: best wishes to you all for 2015!

BlogsRead_ModularityClass3_InDegreeSize copy

Extinction of British bees and flower-visiting wasps – a new assessment of rates and causes

Extinction of species is perhaps the most fundamental assault that we as humans can inflict on the rest of the natural world.  Extinctions take a range of forms, from the loss of a whole species (such as the sad case of the St Helena Giant Earwig, recently declared extinct by the IUCN), down to extirpation of local populations.

For an island nation such as Britain, extinctions at a country level are highly significant because there is limited opportunity for species to disperse across the sea and re-colonise areas where they previously lived.  In a new research paper published this week in the journal Science we have addressed the subject of pollinator declines in the UK and asked the following questions:

1.  How many bee and flower-visiting wasp species have gone extinct in the UK?

2.  Is the rate of extinction (e.g. number of species per decade) constant or variable over time?

3.  Can we interpret any patterns in relation to broader societal changes, for example in agricultural policy, conservation strategies, etc?

The research is a collaboration between myself and University of Northampton colleagues Dr Robin Crockett and Dr Hilary Erenler, together with Mike Edwards from the Bees, Wasps & Ants Recording Society (BWARS), the c. 500,000 records of which were used in these analyses.  This is probably the most extensive data set on these insects available for any country and an important resource.

The answer to the first question is that 23 species of bees and flower-visiting wasps have gone extinct, ranging in time from the crabronid wasp Lestica clypeata (last observed in 1853) to the solitary bee Andrena lathyri (not seen since 1990).  All of these species still occur on mainland Europe, so these were country-level extinctions, not species extinctions.

The answer to questions 2 and 3 is that the rate of extinction is highly variable, and by using a novel statistical approach adapted by Robin to analyse the changing rate over time, we found that the main period of species loss followed changes to agricultural policy and practice just after the First World War.  This is much earlier than previously believed: until now it has usually been the Second World War and the subsequent Common Agricultural Policy which have been seen as the main drivers of pollinator loss.  This figure produced by Robin shows the results in detail:

Figure 2 colour

The four periods marked in red are the points where we estimate the rate of extinction changed (with 99% confidence intervals shown in pink).  The most rapid rate of extinction (shown by the solid blue piecewise regression lines and dashed 99% confidence intervals) is from the late 1920s to the late 1950s.  This, we believe, is the cumulative effect of agricultural changes precipitated and then augmented by the First and the Second World Wars, respectively.

The period of extinction from the late 19th into the early 20th centuries was probably caused by increased import of South American guano as soil fertilizer which increased grass productivity at the expense of wild flower diversity.  This reduced reliance on strict rotational cropping, including fallow periods with nectar- and pollen-rich weeds, and N-fixing legume years.  However it was the invention of the Haber Process in 1909, allowing industrial manufacture of inorganic nitrogen fertilizers for the first time, that fundamentally affected British agriculture.

The slow down of the rate of extinction from the early 1960s to the mid 1980s is not easily explained given the continued intensification of farming, encouraged by Common Agricultural Policy subsidies.  It could be due to the most sensitive species having been already lost, or because of conservation initiatives including the establishment of more nature reserves by organisations such as the Wildlife Trusts and the RSPB, habitat restoration and management by groups such as the British Trust for Conservation Volunteers, more farmers going organic, etc.  Or it could be a combination of both, and/or factors we’ve not yet thought of.

The final period of extinctions from 1986 to 1994, where the rate seems to increase, could be seen as evidence against the slowing in the rate of decline of pollinators in north west Europe found by Carvalheiro et al. (2013).  However  we need to be cautious here as there’s a large confidence interval around the calculated extinction rate.  The four extinctions between 1988-1990 could be an isolated cluster, or the start of a further period of relatively high extinction rate.  Only time will tell!

Bees, wasps and other pollinating insects are absolutely vital to the functioning of our natural ecosystems and for a great many agricultural crops.  We’ve known for some time that these insects are declining in Britain but now we can see how historical agricultural changes have caused species to become extinct. The big question is whether these extinctions have stopped or whether they will continue in the future. The species that have been lost to Britain still survive on the Continent and there is the possibility of natural re-colonisation or artificial reintroduction, both of which have occurred in recent years.  However in order for this to be successful we must restore as much natural habitat as possible within our farmland, which after all covers some 70% of the British land surface.  The irony of our findings, of course, is that pollinators are vital for agriculture, as the UK Government’s National Pollinator Strategy recognises.

Studies such as this illustrates the importance of maintaining the year-on-year effort of recording natural history data – the research simply wouldn’t have been possible without the BWARS records, which are mainly collected by amateur naturalists.

The full citation for the paper is:  Ollerton, J., Erenler, H., Edwards, M. & Crockett, R. (2014) Extinctions of aculeate pollinators in Britain and the role of large-scale agricultural changes. Science 346:1360-1362.  I’m happy to send a PDF to anyone who requests a copy for personal use. 

Notes:

1.  We define “extinction” as ≥ 20 years since the last recorded occurrence of the species in Britain, which is why the data stop at 1994.

2.  We have excluded single early records of species that cannot be verified as representing stable breeding populations.

3. Analyses were performed using the ‘segmented’ library in R (www.r-project.org)

4.  Thanks to Robin Crockett for the figure and the analyses, and Hilary Erenler and Mike Edwards for their input into the study.

Winter visit to Wicken Fen

P1120027

If it’s winter, it must be time for the annual second year undergraduate field trip to Wicken Fen, a yearly pilgrimage that’s been run by my colleague Dr Janet Jackson for many years now.  The purpose of the trip is to show our ecology and environmental science students an example of large-scale habitat conservation and restoration in action, at one of England’s oldest nature reserves.  I try to go along and help out when I can, though I missed it last year because of my trip to Brazil.  It was more than a fair swap, though there’s something about Wicken’s stark winter beauty that always makes for a memorable day.

2014-12-05 12.07.59

The National Trusts’s nature reserve at Wicken Fen is one of the few remaining patches of the wetland habitat that once covered most of East Anglia.  There’s little of it left (less than 1% of the original area) but large-scale, long-term initiatives such as the Great Fen project and the Wicken Fen Vision are trying to increase this by restoring the farmland surrounding the remaining patches.  This is important landscape-scale conservation because the fenland habitat is rich in biodiversity.  Wicken Fen alone is reckoned to host more than 8,300 species of macro-organisms, most of which are invertebrates, including more than a thousand each of flies and beetles.  There’s also an impressive list of birds that use the site either for breeding or over-wintering, and on our day trip we managed to see 31 species*, highlights of which were a pair of Hen Harriers, a lone hunting Barn Owl at dusk, and a huge flock of Lapwing and Golden Plover that provided a backdrop to our guided tour.

P1120025

Another great highlight which impressed both students and staff was a close encounter with some Konik Polski ponies which were curious and friendly, and yet more or less wild, as they stay out on the Fen all year round with no shelter and the minimum of human intervention.

Konic ponies

Everyone was enchanted by these hardy little horses and it was a struggle to get the students to move on with the tour!

Konic ponies with Janet

As Carol Laidlaw, conservation grazing warden at Wicken Fen explained to us, these ponies, together with the tough highland cattle, are a vital part of Wicken Fen’s ecology.  Their grazing prevents woody plants from colonising, and this, together with their physical presence in the landscape, leaving hoof marks and dung piles, opens up both small patches and larger areas for colonisation by plants.  For anyone interested in reading more about the grazing animals I can recommend Carol’s excellent article on the project.

P1120033

Although the day was cold it was not the frozen landscape we normally encounter and there were even a few plants still in flower.  It’s been a mild winter so far – how long will that continue?  If you’ve never visited Wicken Fen I can recommend it as a day trip whatever the season or weather, there’s always fascinating wildlife to see.

2014-12-05 15.57.39

*Bird list for the trip was: Collared Dove, House Sparrow, Blackbird, Kestrel, Fieldfare, Goldfinch, Cormorant, Grey Heron, Magpie, Lapwing, Golden Plover, Carrion Crow, Snipe, Hen Harrier, Wigeon, Great Tit, Blue Tit, Feral Pigeon, Starling, Wood Pigeon, Robin, Chaffinch, Wren, Shoveler, Tufted Duck, Coot, Mallard, Common Gull, Herring Gull, Jackdaw, Barn Owl.  Plus chickens being kept in the garden of one of the local cottages!

Pollinator seminar at Westminster – the official version – and that 1,500 figure

20141028_180501

Last month I wrote a personal account of the National Pollinator Strategy Seminar held at Westminster.  This week the Parliamentary Office for Science and Technology released their official summary of the event plus PDFs of the slides of some of the participants.  They can be downloaded from this website.  It was an interesting seminar and it’s well worth taking time to study these documents; they are very accessible for the non-specialist.

One thing that’s unclear to me from this account is with regard to the statement that:  “there are approximately 1,500 insect species that pollinate food crops and wild plants, including bees, hoverflies, wasps, flies, butterflies, beetles and moths”.  The National Pollinator Strategy also cites that figure, though says “at least 1,500” species.

Where does the 1,500 figure come from?  Does anyone know the original citation?  I genuinely can’t recall if I’ve ever seen it published.

A quick back of the envelope, conservative calculation suggests to me that 1,500 species is too low:

Aculeates (bees plus wasps minus ants) =  500
Butterflies =     59
Macro-moths (assumed 50% flower visitors) =  400
Hoverflies =  250
Other flies (assumed 10% flower visitors) =  700
Beetles (assumed 5% flower visitors) =  200
Total species = 2109


Links are included to the sources of the original diversity figures.  I’ve rounded some of the figures down and the % flowers visitors figures for moths, flies and beetles is pure guestimate based on my field experience.  But they are not likely to be way out, and if anything could be an under-estimate for flies and beetles; moths could be too high, though most species do feed as adults.  Aculeate Hymenoptera (bees and wasps) could also be an over-estimate, but then that figure doesn’t include the non-aculeate “wasps” that frequently visit flowers, for example many ichneumonids and sawflies.

Does it matter?  I think so: as scientists it’s important that we provide the most accurate data that we can to governments and other bodies that may use it for policy, strategy and advocacy.

As always I’d be pleased to receive your comments.

Urban pollinators for urban agriculture (and horticulture!)

P1010430

Over the past few weeks I’ve been thinking a lot about urban pollinators, that is to say bees, hoverflies, butterflies, and other animals, living and foraging in towns and cities.  As I recounted in my recent post about the National Pollinator Strategy seminar at Westminster, Jane Memmott presented some of the first data from the Urban Pollinators Initiative which is looking very interesting.  At the same time, Muzafar Hussain has submitted the first manuscript from his PhD study of urban solitary bees in Northampton, and will hopefully be defending his thesis early next year.  More recently I was asked to examine the PhD thesis of  Rob Fowler at the University of Birmingham, whose focus has been on pollinators across an urban-rural gradient.  Rob did very well and I look forward to seeing his work published.

Interesting though all this work is, it’s largely being done outside the context of crop pollination per se, focusing mainly on the identity and abundance of these urban pollinators.  It’s timely, therefore that a study has just been published by Thebo et al. in the journal Environmental Research Letters entitled  “Global assessment of urban and peri-urban agriculture: irrigated and rainfed croplands” which gives the first comprehensive figures on the extent of agriculture in and around the world’s large towns and cities.  The paper is open-access so you can read its findings for yourself, but the main message is that urban agriculture is more extensive and important than previously assumed, and there are significant implications for food security and water resources.

The research has (justifiably) received quite a lot of publicity in the media, for example on the BBC News website, and is a great contribution to a still limited field of study.  One aspect jumped out at me though; when discussing the limitations of their methods the authors state that: “the scale and methods used……are not structured to capture very small, spatially dispersed areas of urban croplands”.  In other words, urban gardens and allotments are not included in this assessment.  In the UK at least this is a significant limitation as we know that urban fruit and vegetable growing is widespread, though as far as I’m aware there’s no published figures on the volume and value of this local horticulture of food crops.

Which brings us back to urban pollinators: a significant fraction of these crops (large-scale and local garden) requires pollination by insects.  As I reported back in July, in our own urban garden this includes at least 15 crops (strawberries, apples, greengages, cherries, blackcurrants, squashes, courgettes, blackberries, fennel, runner beans, french beans, passion fruit, tomatoes, raspberries, and radish pods).  An integrated study of urban agriculture/horticulture in the context of pollinator diversity and abundance would be a great piece of research and is long overdue.