Author Archives: Jeff Ollerton

Unknown's avatar

About Jeff Ollerton

Independent consulting scientist and author, working on understanding and conserving biodiversity

The good and the bad in biodiversity

20180928_154925

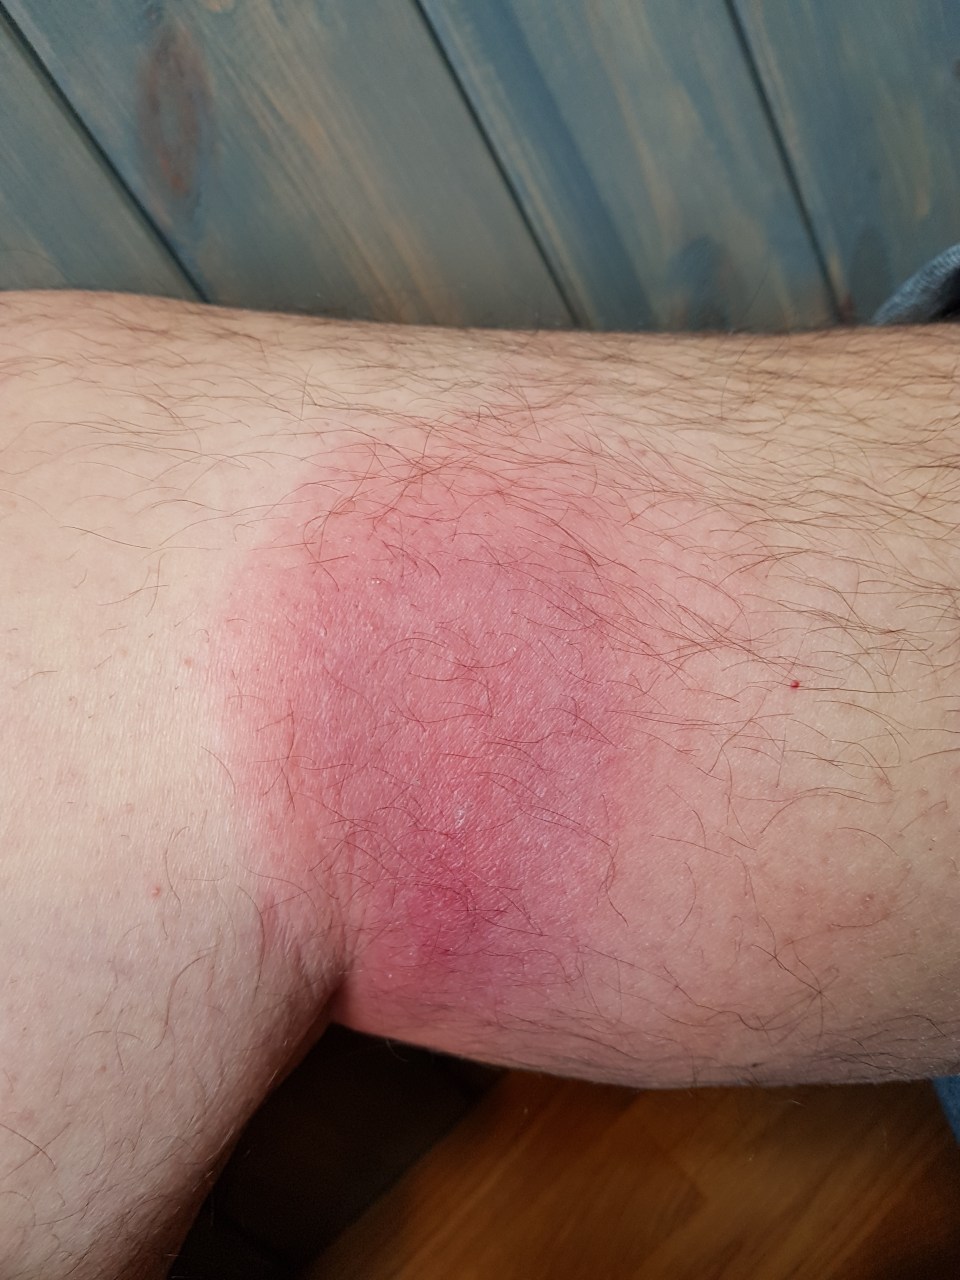
At some point last week a small fly bit my leg, perhaps a biting midge in the family Ceratopogonidae*.   In doing so, the fly infected the wound with bacteria, possibly a Staphylococcus species.  That’s turned into a large, painful cellulitis (pictured) that is causing fever, body aches, dizziness, sweating, sleep problems, exhaustion, and general unwellness**.  Although I love biodiversity, sometimes it causes all kinds of health problems for humans.  Bad biodiversity.

A visit to my GP yesterday afternoon resulted in her prescribing me a course of antibiotics, specifically clarithromycin.  Although this is a synthetic antibiotic it was developed as a variant of erythromycin which in turn is a natural antibiotic isolated from the bacterium Streptomyces erythraea.  Good biodiversity.

There’s a temptation in environmentalism to see nature as all good, a Mother Earth that provides for us.  Which it does, and one way of considering these benefits is as ecosystem services.  However nature also inflicts a whole range of ecosystem disservices on the human population of this planet, backed up by some of its biodiversity.  Nature is neither all good nor all bad, it just is.

My first year undergraduate classes start next week with the module Biodiversity: an Introduction.  I hope to be well enough to teach it and at some point I’ll use this as an example the good and the bad in biodiversity.


*Ironically flies in this family are major pollinators of one of the main groups of plants I study in the genus Ceropegiasee this post from last year.

**And a pain in the arse to my wife – sorry Karin!  It was she who persuaded me to go and see the GP after a few days of “no, no, it will get better on its own….”

Hornets are pollinators too!

20180926_121735

This morning I spent a very pleasant couple of hours walking around the farm that’s at the heart of the Warner Edwards Gin Distillery, in Harrington just north of Northampton.  We are setting up some collaborations around conservation and sustainability between the university and Warner Edwards.  The first of these involves surveys of their farm by one of our final year undergraduates, Ellie West, to assess pollinator diversity and abundance, and opportunities for habitat enhancement on the farm.

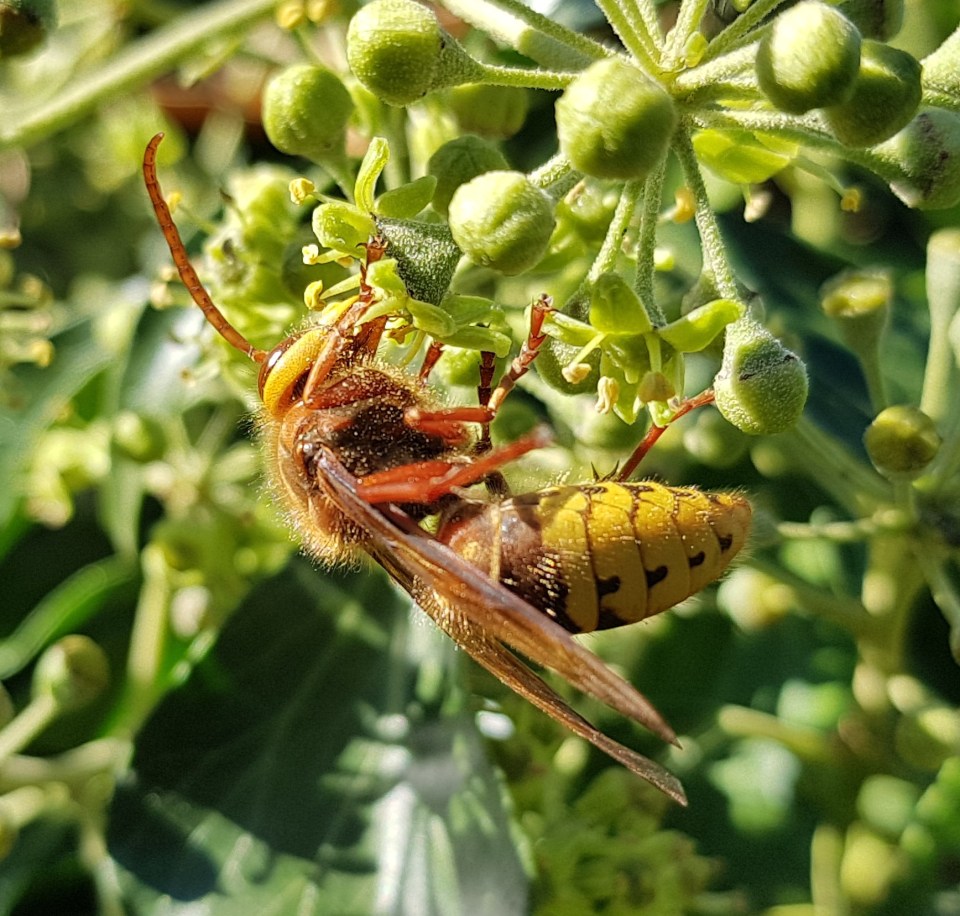
One of the highlights of this morning’s visit was seeing this gorgeous hornet (Vespa crabro) taking nectar from common ivy (Hedera helix).  I think that she’s a queen stocking up on energy prior to hibernating.  But just look at how much pollen she’s carrying!  There’s every chance that she’s a very effective pollinator of ivy, which is a key nectar resource at this time of year.  It’s such an important plant in other ways too: ivy binds the landscape physically and ecologically, in ways few other native plants do.  Pollination by insects such as hornets (and hundreds of other species) results in berries that are eaten by birds and mammals, whilst the branches and dense, evergreen canopy provides nesting sites for birds and shelter for over wintering insects.

Hornets and ivy: two of my favourite native British species.

20180926_121532

Which h index should I use? UPDATED

2018-09-16 10.04.28

UPDATE:  Thanks to my kind commentators (below) who pointed out that one can change Google Scholar, taking out papers that don’t belong, merging variants, etc.  It had been a while since I looked at Google Scholar and perhaps I knew this in the past but had forgotten.  However I had an issue with it linking to my Google account and so had to delete the old profile and set up a new one.  That seems to have worked OK, I have got rid of the publications that weren’t mine, and my h-index looks to be fairly accurate at 38.  I have adjusted the text below to reflect this.

————————————————————————-

Despite some (well founded) criticism as to its usefulness, the h-index seems to be with us to stay.  In a couple of posts I’ve articulated some of its advantages and disadvantages – see for example What’s the point of the h-index? and How does a scientist’s h-index change over time? – and it’s clear that more and more funding agencies are using it to evaluate the track record of applicants.  Just this afternoon I finished the second of a couple of grant reviews in which the applicant was asked to state their h-index.  What they were not asked was which h-index they should state, i.e. the source of the value, though I think that this is important information.  Why?  Because it varies so much depending on where the it comes from.  I’ll give you an example – here’s my own h-index values taken from a few different sources:

Google Scholar: h = 38

ResearchGate: h = 36

ResearchGate (excluding self citations): h = 34

Web of Science (all databases): h = 34

Web of Science (Core Collection): h = 29

Scopus: h = 29

There’s a 10 point difference (almost 25%) between the largest and the smallest values.  So which one should I cite in grant applications, on my CV, etc.  Well the largest one, obviously!  Right?  Well maybe, but not necessarily.  In fact none of these values are completely accurate, though some are more accurate than others.

Web of Science includes papers and book chapters that don’t belong to me, and I can easily shave a couple of points off that value.  Some of these mis-attributions are chapters from a volume that I co-edited.  Some are papers that I edited for PLoS ONE and which have been assigned to my record.  Others are for the two or three other researchers named “J. Ollerton” who are out there.  Google Scholar had some entries which are just bizarre, such as “The social life of musical instruments” by Eliot Bates, which Google Scholar seems to think I wrote and has credited me with its 102 citations.  However, as you can see form the update, I’ve corrected this.

Web of Science and Scopus don’t pick up as many citations in books or reports as does Google Scholar which is a deficiency in my opinion.  Being cited in a peer-reviewed journal is often thought of as being the gold standard of citation but frankly I’m very happy to be cited in government and NGO reports, policy documents, etc., which themselves may often be peer reviewed, just by a different type of peer.

Poised in the middle of this range, ResearchGate may be most accurate but it lacks transparency: as far as I can see there isn’t a way to look at all of your citation data per paper in one go, you have to look at each publication individually (and who has time for that, frankly?)

As far as calculating an accurate h-index is concerned I don’t think we will ever come to an agreement as to what should be considered a publication or a citation.  But systems like Google Scholar and Web of Science should at least try to be accurate when assigning publications to an individual’s record.

So which h-index should you use?  In the interests of accuracy and honesty I think it’s best to state a range and/or add a proviso that you have corrected the value for mis-attribution of publications.  In my case I’d say something like:

“Depending on source my h-index lies between 29 (Scopus) and 38 (Google Scholar)”.

If the h-index is to have any value at all (and there are those who argue that it doesn’t and shouldn’t) then it requires us as scholars to at least try to make it as accurate as we can.  Because frankly I don’t think it’s going to go away any time soon.


Why I’m joining the People’s Walk for Wildlife on Saturday 22nd September

Peoples walk for wildlife

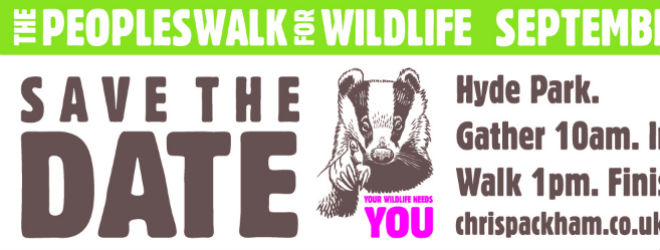
If you live in the UK and have an interest in wildlife you’ve probably heard about the event that takes place in London this coming Saturday:  The People’s Walk for Wildlife.  If you follow that link you’ll find a video of Chris Packham explaining what the walk is all about and why he’s organised it, plus logistical information, timings, etc.

Karin and I are going to join the walk and I thought I’d give a brief summary of why I think it’s important for people to take part.

If you watch the video you’ll see that Chris does a great job of laying out the issue of wildlife loss, a loss not just of species but of abundance.  There are species that still can be found in Britain but which have declined in numbers by 90% or more over my lifetime.  Such species can be found in all of the major groups of biodiversity in this country:  birds, mammals, fish, reptiles and amphibians, insects and other invertebrates, fungi, and plants.  Many, many millions of individuals gone from our countryside.

Why has this happened?  Well, the causes are complex and inter-related.  Agricultural intensification over the last century has been a major issue as I’ve previously discussed on this blog in relation to pollinator extinctions.  But that’s only part of it. Another big problem that we have in the UK is an unwillingness to let nature just get on with itself.  We feel that we have to manage everything: Too many ravens?  Cull them.  Hedgerows or road verges looking a bit untidy?  Cut them.  Old tree infected with a fungus?  Chop it down.

In part this mindset is linked to an idea of what natural heritage should look like, an idea of order within a landscape, of making the countryside look pretty, and of doing things simply because that’s what our predecessors did.  A good example was recently tweeted by Dave Goulson who had found mole traps on a Natural Trust property that he visited; as Dave rightly said:  “When will we stop slaughtering harmless wildlife that causes us the tiniest inconvenience?”  There is no reason in this day and age to kill moles – what conceivable harm do they do?  In fact, as ecosystem engineers, they are an important part of the ecology of the British countryside.

One of the reasons why this is happening largely unnoticed by the government agencies responsible for the environment is that our landscapes change at a very slow rate.  Indeed places like the Lake District or the Scottish Highlands or the Chiltern Hills look much the same as they have done for hundreds of years.  Visually they are still stunning places to visit and that’s why they attract millions of tourists every year, and also why people enjoy living there.  But they have lost much of their wildlife and, with it, some of the ecological function that makes them work as ecosystems.  If this continues then natural processes such as dispersal of seeds by birds and mammals, and the subsequent maintenance of tree populations, will cease.

But that’s okay isn’t it?  Trees and shrubs not establishing themselves: go out and plant them by hand.  Is this really what we want?  If it is then we will end up turning our countryside into a museum.  And not even a very good museum at that: not a museum with dynamic interactive displays, rather a static, dull set of exhibits that you can only peer at through dusty glass.

So that’s why we are joining the People’s Walk for Wildlife next Saturday: this is an important issue and people need to show government that they are concerned.  I hope you agree and I hope you will join us.

Dave G. has promised to come dressed as a bumblebee; I’ve seen his costume and he’s a man of his word, so it’ll be worth looking out for him.  I can’t promise anything so flamboyant but I may well take a placard that says something like:  “Save ALL of our pollinators, not just bees!”  If you spot it, do some over and say hello.

There ain’t no b(ee) in Starbucks

20180906_180451

I do love a road trip.  Karin and I are just back from a drive too and from her homeland of Denmark, via ferry from Harwich to Hook of Holland, in order to pick up a porcelain dinner service that belonged to her grandparents.  It was a great trip and I hope to put up some photos from that shortly.  But before then I thought I’d write a short post about a key element of any good road trip:  coffee.

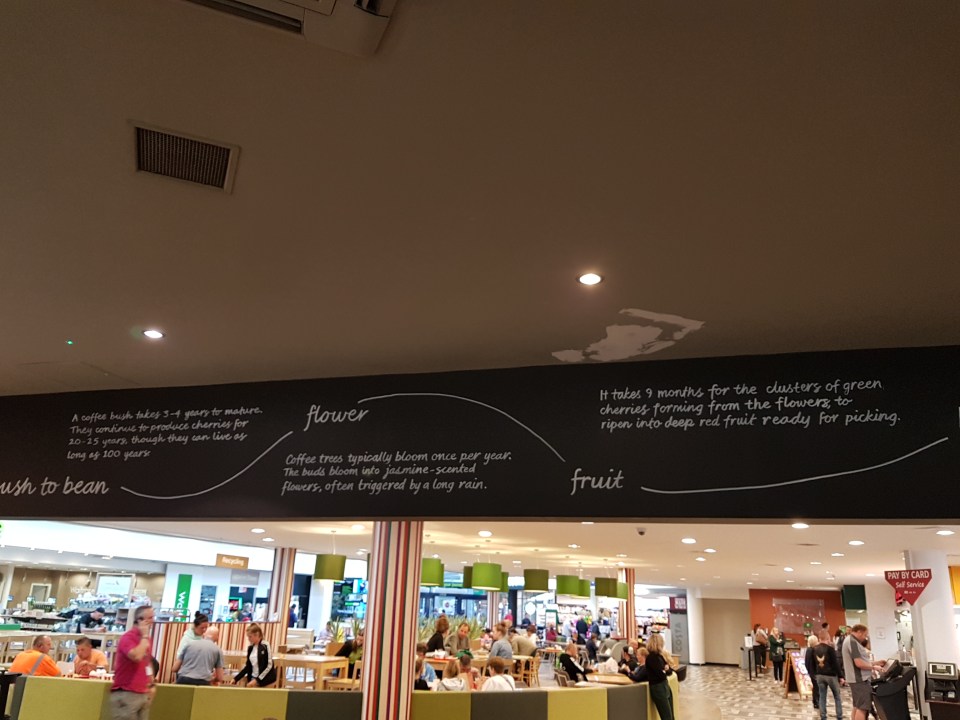
If I drive for two hours or so I have to take a break and top up with at least a coffee, possibly also a snack, certainly lunch at the appropriate time.  Last Friday, en route to Harwich, we stopped off at a motorway service station that had a Starbucks.  Whilst waiting for my coffee (Americano, no milk, thank you very much) I noticed that there was quite a lot of text on the walls all about where and how coffee grows, its cultivation and harvesting, and so forth.  Being the sort of ecologist who is interested in how plants flower and set fruit I focused on the relevant text (see the photo above).  It’s a little indistinct but, in essence, this is what it says:

“Coffee plants flower once a year…..the flowers are jasmine scented….and then some magic happens….and nine months later you get coffee fruit”

Okay, I made up the bit about “magic” but, seriously, that’s what is implied by this text: that by some hocus pocus, coffee flowers turn into the coffee fruit that contain the beans.  No mention made of the fact that pollinators (mainly wild and managed bees) are important in this process.  Although coffee can self pollinate (which is fairly magical I suppose) without the pollinators we would have much less coffee of poorer quality.

In my recent review of pollinator diversity and conservation I did some back-of-the-envelope calculations of coffee production to illustrate the dependence of modern human society on animal pollination. Here’s what I wrote:

“Coffee is pollinated by a range of wild insects (mainly bees) and managed honeybees (Ngo et al. 2011), is second only to oil in terms of its value as a commodity [turns out this is not true – see below*], and supports millions of subsistence farmers. Global coffee production in 2016 amounted to 151.624 million bags, each weighing 60kg (International Coffee Organisation 2017). One coffee bean is the product of a single fertilisation event following the deposition of at least one pollen grain on a flower’s stigma. The mean weight of a single coffee bean is about 0.1g which means there are approximately 600,000 beans in a 60kg bag. The total number of coffee beans produced in 2016 is therefore 151.624 million bags multiplied by 600,000 beans per bag, which equals 90,974,400,000,000, or >90 trillion coffee beans. However coffee is on average 50% self pollinating (Klein et al. 2003) and a single bee visit may pollinate both ovules in each coffee flower, so we can divide that figure by four: nonetheless global coffee production requires at least 22 trillion pollinator visits to flowers. Clearly the global coffee market is supported by many billions of bees that require semi-natural habitat as well as coffee plantations in order to survive”.

I don’t want to pick on Starbucks, it just so happens that that’s where we stopped, and I have certainly seen similar displays in Costa, for instance, with again no mention of bees.  Apparently Starbucks et al. don’t want to acknowledge the role of these bees in supporting their (very lucrative) industry, at least not in the cafes themselves.  If you Google “Starbucks pollinators” then you find some information online about how the company values bees, etc. etc.  But come on coffee sellers, you’re better than this, let the public know in the places where the public goes!  If you need advice from an expert, someone to write some text for you, I’m more than happy to act as a consultant.


*Even careful scientists get things wrong sometimes – this is a myth as you can read if you follow this link.


References

International Coffee Organisation. 2017. Coffee production statistics for 2016. http://www.ico.org/prices/po-production.pdf Accessed 20th June 2017

Klein AM, Steffan-Dewenter I, Tscharntke T. 2003. Fruit set of highland coffee increases with the diversity of pollinating bees. Proc. R. Soc. B. 270: 955–961

Ngo HT, Mojica AC, Packer L. 2007. Coffee plant – pollinator interactions: a review. Can. J. Zool. 89:647–660


The evolution of pollination systems in one of the largest plant families: a new study just published – download it for free

Figure 1 JUNE revision

Interactions between flowering plants and the animals that pollinate them are known to be responsible for part of the tremendous diversity of the angiosperms, currently thought to number at least 350,000 species.  But the diversity of different types of pollination system (bird, bee, moth, fly, etc.) is unknown for most large, related groups of plants (what systematists term “clades”) such as families and subfamilies.  In addition we know little about how these interactions with pollinators have evolved over time and in different parts of the world.  Only a handful of groups of flowering plants have been studied with respect to questions such as:

How much do we currently know about the diversity of pollination systems in large clades?

How is that diversity partitioned between the smaller clades (e.g. subfamilies, tribes, genera) of a family, and what are the evolutionary transitions between the major groups of pollinators?

Do these pollination systems vary biogeographically across the clade’s range?

These sorts of questions have been addressed for the massive, globally distributed Apocynaceae (one of the top 10 or 11 largest angiosperm families with more than 5,300 species) in a study just published using a new database of pollinators of the family.  What’s more, the work is open access and anyone can download a copy for free.  Here’s the citation with a link to the paper:

Ollerton, J., Liede-Schumann, S., Endress, M E., Meve, U. et al. [75 authors in all] (2019) The diversity and evolution of pollination systems in large plant clades: Apocynaceae as a case study. Annals of Botany 123: 311–325

In this study we have shown that (among other things):

  • The family is characterised by an enormous diversity of pollination systems involving almost all of the major pollen vectors and some that are nearly unique to the Apocynaceae.
  • Earlier diverging clades have a narrower range of pollination systems than those that evolved later.
  • Transitions from one type of pollination system to another are evolutionarily constrained, and rarely or never occur, whereas others have taken place much more often, e.g. between wasp and beetle pollination.
  • There is significant convergent evolution of pollination systems, especially fly and moth pollination, by geographically and phylogenetically distinct clades.

You’ll notice that there are 75 (!) authors on this paper.  That’s because we’ve pulled together a huge amount of previously unpublished data and used some state of the art analyses to produce this work.  It was a monumental effort, especially considering that my colleague Sigrid Liede-Schumann and I only decided to push ahead with this project about a year ago when we chatted at the International Botanical Congress that I posted about at the timeIn truth however the origins of this paper go back over 20 years to 1997 when when Sigrid and I published a study of what was then known about pollination systems in the Asclepiadaceae (the asclepiads).

In that paper we said that the research “is intended to be ongoing…[we]…hope to re-review asclepiad pollination within the next decade”.  At the time I didn’t think it would actually take more than 20 years!  However over that period a lot has changed.  For one thing the Asclepiadaceae no longer exists, broken up and subsumed within a much larger Apocynaceae.  Also, I’ve done a lot of work in the field and in the herbarium on some of the smaller groups within the family, such as CeropegiaOthers, including many of my co-authors, have also been working on different groups in various parts of the world.  Finally the level of sophistication of the analyses we are now able to do has increased beyond recognition compared to what we could achieve in the mid-1990s.  All of this means that now is the right time to produce this study.

Having said all of that, this is still a work in progress.  Our Pollinators of Apocynaceae Database contains a sample of just over 10% of the species in the family.  So lots more data on plant-pollinator interactions needs to be collected before we say we fully understand how pollination systems have evolved in this most remarkable family.  I’d be happy to talk with anyone who is interested in the family and being involved in future data collection.

The database will be freely available to anyone who wants to use it – lots more can be done with this information and, once again, I’m happy to chat with potential collaborators.

I was recently interviewed about the study, and about plant-pollinator interactions and the Apocynaceae more generally, for the In Defense of Plants podcast – here’s a link to that interview.

Finally, I’d like to express my sincerest thanks to my co-authors on this study – I really couldn’t have done it without you guys!

British phenological records indicate high diversity and extinction rates among late-summer-flying pollinators – a recently published study

Balfour et al Figure 1

Natural history records of plant flowering and pollinator foraging, much of them collected by well informed amateurs, have huge scientific importance. One of the values of such records to ecology is that it allows us to document where these species occur in space and when they are active in time. This can be done at a range of spatial and temporal scales, but large-scale patterns (for example at a country level) are, I think, especially useful because they provide scientific evidence that can inform national conservation strategies.

During 2017 I collaborated with a young early career researcher at the University of Sussex, Dr Nick Balfour, on an analysis of the phenologies of British pollinators and insect pollinated plants.  That study was recently published (see citation below) and I think that the results are fascinating.

Nick did most of the leg work on this, which involved assessing more than one million records that document the activity times of aculeate wasps, bees, butterflies and hoverflies held in the databases by three of the UK’s main insect recording organisations, the Bees, Wasps and Ants Recording Society (BWARS), the UK Butterfly Monitoring Scheme (UKBMS) and the Hoverfly Recording Scheme (HRS).  Information on flowering times was taken from a standard British flora (Clapham et al. 1990 – Flora of the British Isles. Cambridge University Press).

As well as looking at annual flight periods and flowering trends for these organisms we also focused on pollinator and plant species that were endangered or extinct. Here are some headline results and thoughts on what the work shows:

  • About two-thirds (62%) of pollinator species peak in their flight times in the late summer (July and August), though there was some variation between the different groups – see the figure from the paper above).  Particularly noticeable was the double peak of the bees, with the first peak denoting the activity of many early-emerging solitary bees, such as species of the genus Andrena, whilst the second peak is other solitary bees plus of course the bumblebees which by that time have built up their colonies.
  • A rather fixed phenological pattern with respect to different types of plants was also apparent, which I was not expecting at all: insect pollinated trees tend to flower first, followed by shrubs, then herbaceous species (again, refer to the figure above). This might be because larger plants such as trees and shrubs can store more resources from the previous year that will give them a head start in flowering the following year, but that idea needs testing.
  • Putting those first two points together, what it means is that trees tend to be pollinated by those earlier emerging bees and hoverflies, whereas the herbs are mainly pollinated by species that are active later.
  • When looking at the extinct and endangered pollinators, the large majority of them (83%) were species with a peak flight times in the late summer, a much larger proportion than would be expected given that 62% of all species are active at that time. However this was mainly influenced by extinct bee species and the same pattern was not observed in other groups.
  • The obvious explanation for that last point is that historical changes in land use have led to a dramatic reduction in late summer flowering herbaceous species and the subsequent loss of floral resources has been highly detrimental to those bees. But intriguingly no such pattern was apparent for the endangered pollinators and clearly there are complex reasons why pollinators should become rare or extinct, a point that I have discussed previously on the blog.
  • The lack of late summer flowering resources for pollinators is a contentious issue however as plant conservation groups have in the past recommend that meadows and road verges are cut in late summer to maximise plant species richness.  Mowing road verges once or twice a year certainly benefits plant diversity, as this recent review by Jakobsson et al. (2018) demonstrates.  But there’s very little data available that assesses how timing of cutting can affect pollinators.  The only study that I know of (and if I’ve missed any, please let me know) that has considered this is the PhD work of one of my former students, Dr Sam Tarrant who looked at pollinators and plants on restored landfill sites compared to nearby nature reserves.  In a paper that we published in the journal Restoration Ecology in 2012 we showed that on restored landfill sites the abundance of pollinators in autumn surveys (conducted September-October) was just as high as for summer surveys.  On nature reserves, which are routinely cut from mid-July onward, this was not the case.

Here’s the full citation of Nick’s study with a link to the publisher’s website, and a copy of the abstract is below.  If anyone wants a PDF, drop me a line:

Balfour, N., Ollerton, J., Castellanos, M.C., Ratnieks, F.L.W. (2018) British phenological records indicate high diversity and extinction rates among late-summer-flying pollinators. Biological Conservation 222: 278-283

Abstract:

The long-term decline of wild and managed insect pollinators is a threat to both agricultural output and biodiversity, and has been linked to decreasing floral resources. Further insight into the temporal relationships of pollinators and their flowering partners is required to inform conservation efforts. Here we examined the
phenology of British: (i) pollinator activity; (ii) insect-pollinated plant flowering; and (iii) extinct and endangered pollinator and plant species. Over 1 million records were collated from the historical databases of three British insect monitoring organisations, a global biodiversity database and an authoritative text covering the national flora. Almost two-thirds (62%) of pollinator species have peak flight observations during late-summer
(July and August). This was the case across three of the groups studied: aculeate wasps (71% of species), bees (60%), and butterflies (72%), the exception being hoverflies (49%). When species geographical range (a proxy for abundance) was accounted for, a clear late-summer peak was clear across all groups. By contrast, there is marked temporal partitioning in the flowering of the major plant groups: insect-pollinated tree species blossoming predominantly during May (74%), shrubs in June (69%), and herbs in July (83%). There was a positive correlation between the number of pollinator species on the wing and the richness of both flowering insect pollinated herbs and trees/shrubs species, per calendar month. In addition, significantly greater extinctions occurred in late-summer-flying pollinator species than expected (83% of extinct species vs. 62% of all species). This trend was driven primarily by bee extinctions (80% vs. 60%) and was not apparent in other groups. We contend that this is principally due to declines in late-summer resource supplies, which are almost entirely provisioned by herbs, a consequence of historical land-use change. We hypothesize that the seasonality of interspecific competition and the blooming of trees and mass-flowering crops may have partially buffered spring flying pollinators from the impacts of historical change.

A once in a lifetime sunset?

2018-08-09 20.37.34

It’s been a curious year in the UK, weather wise, with an early, mild spring interspersed by sudden cold snaps that may (or may not) have had a profound impact on pollinators, and then a summer that was hotter and drier than any in living memory.  There’s been some amazing thunderstorms and torrential rains, and weeks when there was no rain at all.  Then, on Thursday evening, as Karin and I were coming back from a walk around Abington Park (via a quick stop in the pub) the heavy, rain-bloated skies conspired with the setting sun to produce, for a brief period, a display of light and clouds that was more vibrant and gorgeous than any I’ve ever seen.  The sky reflecting from the rain-soaked pavements of Northampton added further drama to what may well be a once in a lifetime experience.

Here are a few shots I managed to take using the camera on my phone; I’ve not altered the colour or played with images in any way, but they do partial justice to the quality of the light that evening.

2018-08-09 20.31.46

2018-08-09 20.38.56

2018-08-09 20.35.55

2018-08-09 20.32.46

Pollinators, landscape and friends: our recent trip to the Danish island of Sejerø

2018-07-15 11.16.02

This is not the first time I’ve written about the beautiful Danish island of Sejerø – see my post “Why do bumblebees follow ferries?“.  It’s home to our friends Pia and Stephen Valentine (Stephen is the very talented artist who produced the fabulous study of waxwings that Karin commissioned for my birthday last year).  Earlier this month we traveled over to stay with them and to explore some more of the island.  Here are some photos and thoughts from that trip.

Despite the hot, dry weather that northern Europe has been experiencing recently there were pollinators aplenty.  Thistles and knapweeds (both groups from the daisy family Asteraceae) are well known to be drought tolerant and attract a lot of insect interest.  This is a Pantaloon Bee (Dasypoda sp.)  If it was Britain I’d say that it was D. hirtipes, but there are other species on the continent so I can’t be sure.  These bees are well named: the “pantaloons” are found only on the females and are used to collect pollen, especially from Asteraceae.

2018-07-14 14.44.18

I believe that this is the male of this species; note the absence of the pollen-collecting hairs on the rear legs and the yellow face, typical of many male bees:

The flower heads of the knapweeds were highly sought after; on this one, two different bumblebees (Bombus spp.) were competing with two Silver Y moths (Autographa gamma):

2018-07-14 14.59.22

Sometimes the bumblebees got an inflorescence to themselves, though the photobombing Silver Ys were never far away:

2018-07-13 13.41.07

It’s been a good year for the Silver Y, large numbers have migrated northwards from southern Europe and we’ve had lots in our garden too.  On Sejerø they were everywhere, on all kinds of plants: 

2018-07-14 14.53.52

The butterfly is one of the Blues (Lycaenidae), possibly Common Blue (Polyommatus icarus), but again this being Denmark they may have other species that I’m not familiar with.  Note the Silver Y photobombing once more…:

2018-07-14-14-53-46.jpg

Wild carrot (Daucus carota) was common on the island and always attracts a wide range of flies, wasps and beetles:

2018-07-13-12-54-08.jpg

2018-07-13 11.53.40

Close to home we found a huge cherry tree laden with the fruits of pollination and collected a couple of kilos for Stephen to make into jam.  Stoning them was messy but fun and a nice opportunity to sit and chat about nature and people:

2018-07-14 11.05.32

I was very impressed with Stephen’s up-cycled general purpose baskets, made from plastic containers he finds on the beach, wire, and lengths of old hosepipe:

2018-07-14 11.06.17

Along the shore another edible plant, Sea Kale (Crambe maritima) was attracting a lot of attention from white butterflies (Pieridae) whose caterpillars feed on this and other members of the cabbage family (Brassicaceae):

2018-07-13 11.20.10

I tried a piece of raw leaf; it tasted ok, salty and a little bitter.  Apparently it’s very nice if you blanch the young leaves.  It’s a distinctive and impressive component of the beach flora:

2018-07-14 14.41.16

Amidst the greens, buffs and browns of the beach landscape we encountered the occasional scarlet of a patch of poppies (Papaver sp.):

2018-07-13 13.29.52

Everywhere on the island we saw evidence of the link between life on land and in the sea, and the cycles and processes upon which that life depends.  Sand martins (Riparia riparia – an apt name – “riparian” refers to the interface between land and water) are common and their nest excavations speed up the return of sediments back to the sea:

2018-07-13 12.02.21.jpg

Favoured rocks have been used by gulls and other sea birds for generations, their guano helping to enrich these coastal waters and fueling the primary production of seaweeds and diatoms, which in turn feed other shore life:

2018-07-13 13.39.11

2018-07-13 12.26.00

2018-07-13 12.25.32

2018-07-14 15.55.25.jpg

Evidence of human activities was never far away, though, concrete and steel blending with nature:

2018-07-13 11.55.46

Wheat fields merging with the sky:

2018-07-14 15.13.26

Thanks to Pia and Stephen, and of course Zenja, for making this such a wonderful trip and allowing us to join them in exploring their home island:

2018-07-14 15.19.05

2018-07-13 11.09.36

2018-07-14 15.07.14


Academic job interviews: don’t feel obliged to do everything you said you’d do

Interview transparencies 2018-07-17 17.14.59

Last month I cleared out my office in preparation for our move to the University of Northampton’s new Waterside Campus.  Going through files I’d not opened in decades was a cathartic and occasionally emotional experience.  In one file I came across a box of OHP transparencies from the presentation I gave at my job interview in 1995!  (For younger readers, OHPs were just like PowerPoint, but you carried them around in a box….)

Anyway, the presentation (see photo above) at what was then Nene College of Higher Education set out what my research plans were going to be if I was offered the job. It’s interesting to look back on these research themes and consider whether I did actually do what I said I was going to do (go to my Publications page for details of the papers I’m referring to):

Flowering phenology” – This was a large part of my PhD, which I had completed two years earlier.  At Northampton I did a bit of work,  including a big meta analysis with Mexican colleagues Miguel Munguia-Rosas and Victor Parra-Tabla, but nothing further, though I do have a lot of unpublished data that one day may see the light of, err, day….

Pollination systems in the Asclepiadaceae” – I’ve done a lot of work on this plant family, including field work in South America and Africa, particularly with my German colleague Sigrid Liede-Schumann.  However Asclepiadaceae no longer exists as a separate family (it’s now a subfamily of Apocynaceae).  I have a large paper in press at the moment which assesses the diversity of pollination systems in the Apocynaceae; more on that when it’s published.

Specialisation and generalisation in pollination systems” – yes, done lots on this too, including contributing to the Waser et al. (1996) Ecology paper that’s now racked up >1550 citations, plus assessing latitudinal trends in specialisation.  Still a major focus of my research, it’s an area where there are lots of questions still to be answered.

Reproductive output [in plants]” – very little done since my doctoral work, though questions of annual variation in reproductive allocation were a big part of my PhD.  Has fallen by the wayside rather.

Seed predation” – ditto – it was a major component of my PhD and I published a couple of things but then hardly touched the topic.  A shame in some ways as I still think it’s a fascinating topic.

Pollinator behaviour” – I’ve done some work, mainly on birds and bees rather than the butterfly model system I proposed at the time, which was to work with Dave Goulson on a follow-up of a paper we published on floral constancy in Small Skipper butterflies.  This field has moved on hugely though, with some extremely sophisticated work being done with captive bumblebee colonies for instance.

Overall I think I’ve worked on about 50% of what I said I would do, which I’m more than comfortable with.  Because I’ve also done a whole bunch of stuff I never mentioned at interview, including work on pollinator conservation and interaction network analyses, both of which were hardly thought about in 1995.  There’s also research on the history of science that I was thinking about in the early 90s but which I didn’t present as a major research theme.

The moral of this story for anyone preparing for a job interview for an academic position is: Don’t think that you have to do all of the research that you say you’re going to do in the presentation.  Opportunities come and go, and interests wax and wane.  What is currently seen as exciting research may well, in 10 years time, be seen as old hat or a dead end, or have evolved in ways that provide you with fewer opportunities to contribute.  Prepare to be flexible, but don’t lie about your intentions.  In fact, as recently highlighted on the Dynamic Ecology blog, don’t lie about any aspect of getting an academic job!

One other thing: be realistic.  In retrospect I was too ambitious in the range of areas in which I wanted to do research, though they were all linked.  But over the course of 23 years it’s impossible to say how your research career will develop.  I’m looking forward to the next 23…. 🙂