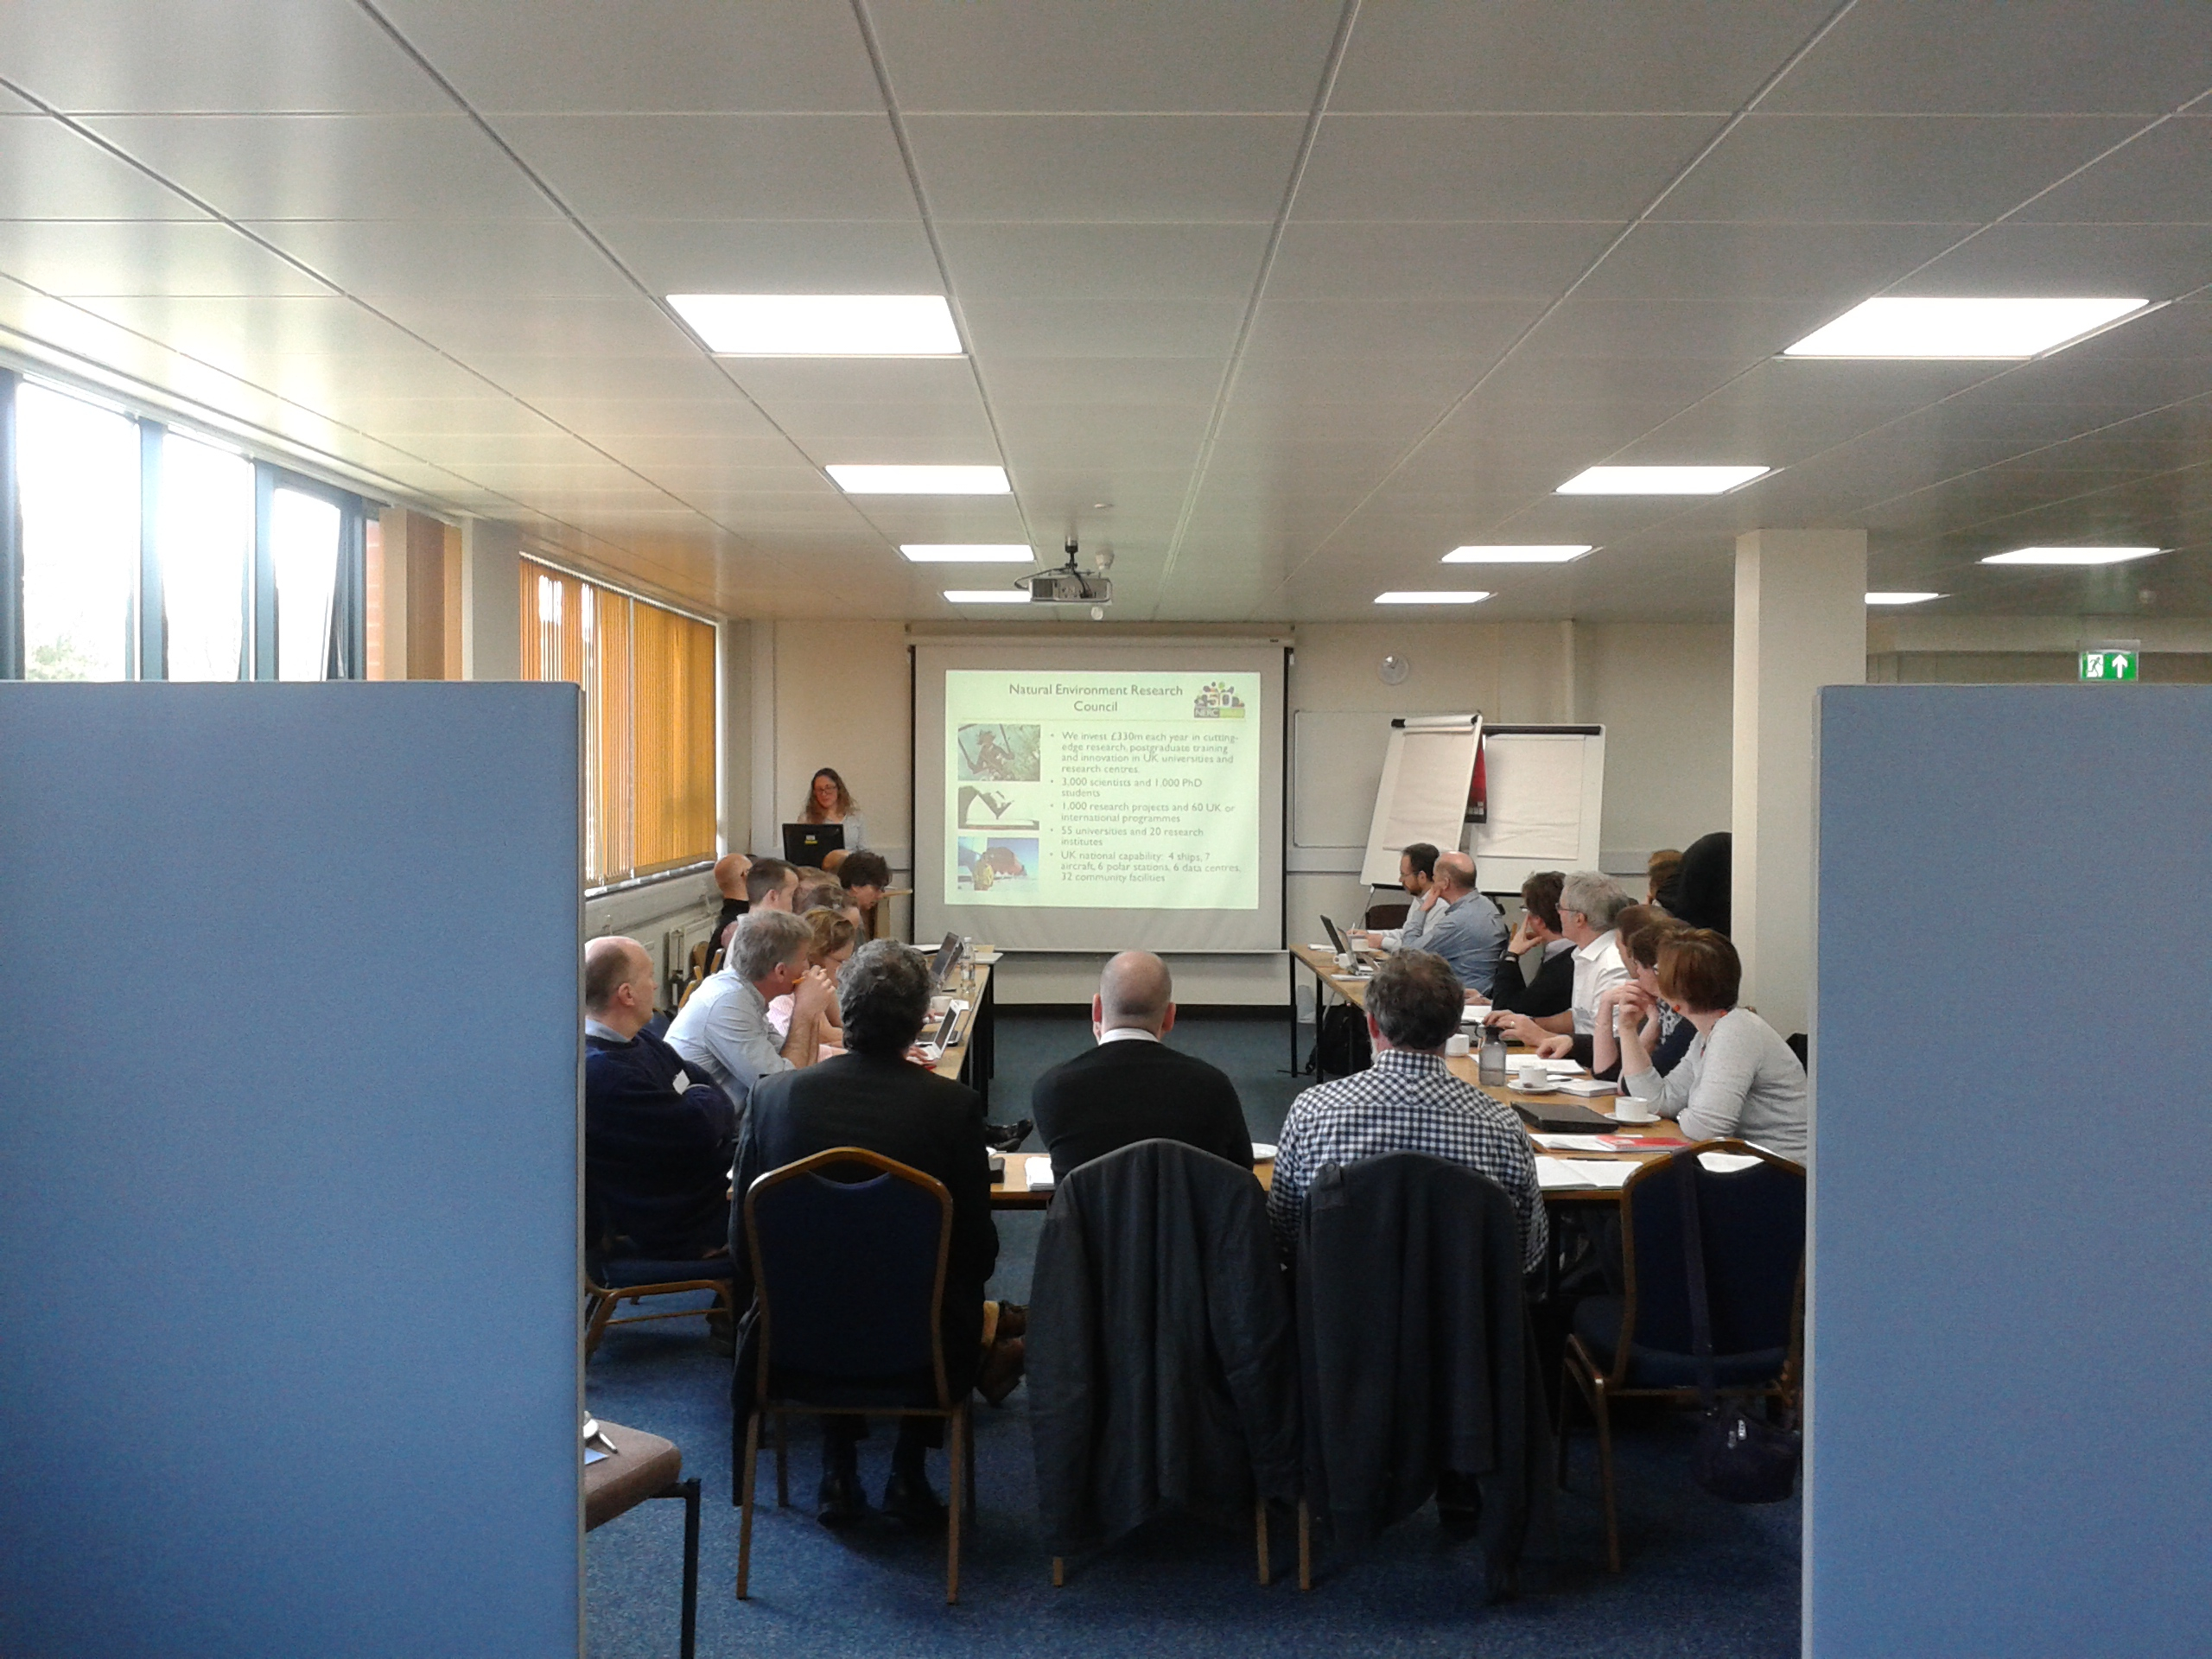
Tag Archives: Science

The state of bees: the European Red List has been published

P1010430

As I’ve frequently reported on this blog, there is growing global concern about declines in pollinator diversity and abundance across many regions, and much research is going on into what is causing those declines, their scale and consequences, and what can be done to reverse pollinator loss. It’s therefore great to see the publication of the European Red List of Bees which provides information on the conservation status of the c. 2000 species of bees in Europe.

The report uses standard IUCN criteria for assessing each species and has been picked up by various media and NGOs, who have typically promoted it with claims such as “Nearly one in 10 of Europe’s wild bee species face extinction“.  However the reality of what the report has found is much more complex and nuanced than the headlines suggest.  Over half of the bee species were classified as Data Deficient, meaning that we don’t have enough information to assess whether they are threatened or not.  Of those that could be classified, 7 species are Critically Endangered, including 3 that are endemic to Europe and found nowhere else in the world; 46 are Endangered including 12 endemics; 24 are Vulnerable, with 7 endemic; 101 are Near Threatened with 17 endemic; 663 are Least Concern (68 endemic), meaning that there are no immediate threats to their survival.

If we turn the “1 in 10” headline around, then a more accurate statement would be “Over 90% of Europe’s bees (for which we have sufficient data) are not immediately threatened by extinction”.  Of course that could change once data for the poorly studied species becomes available.  These are not grounds for complacency; but neither are they grounds for panic.

The scale at which we assess biodiversity is critical if we are to fully understand the threats to species, and when and where limited funds can be prioritised for conservation actions.  Species that are locally endangered or even extinct may actually be quite common when assessed across the whole of their distributional range.  For this reason it’s important to consider the status of species in as wide a geographic region as is possible.  Preferably this would mean a global assessment; but for most species we simply don’t have enough information to be able to undertake such a study, particularly for developing countries where there are limited historical records of species occurrences on which to draw.  Even in a relatively developed region such as Europe, with a long history of natural history observation and monitoring, there are huge gaps in our knowledge – in this case for more than half of Europe’s bees.

With this in mind I looked at the European status of those bee species which are now extinct in the UK, as I discussed in December.  Two of the extinct species are considered Critical (Bombus cullumanus and Andrena tridentata); two are Near Threatened (Dufourea minuta and D. halictula); seven other species are Least Concern; and the remaining two (Andrena lepida and A. lathyri) are Data Deficient.  Clearly some of the UK extinct species are in trouble across Europe, but others are not and may re-colonise the UK in the future, as we believe may have happened in the last couple of years for Andrena vaga.  Or they could be helped to re-colonise via a reintroduction programme, as has been done for Bombus subterraneus

Another way in which to put the findings of this report into a wider context is to consider how the level of threat to bees compares with that of other groups of species.  The authors helpfully provide some comparative data in the summary, which I’ve graphed below (click on it for a better view):

IUCN stats

Overall the proportion of threatened bees is identical to that of butterflies, perhaps because they require some similar resources (flowers on which to feed) and tend to be found in broadly similar habitats.  But other taxa are at much greater risk, particularly freshwater fish and molluscs: yet these taxa have not received the same level of publicity about their plight.  Their are no “Save the Mussels” campaigns, or television series about endangered fish in rivers and lakes.  This is surprising: clearly bees have grabbed the public’s attention because of the role they play in crop pollination, but freshwater fish are also suppliers of ecosystem services either directly (fishing) or indirectly (playing a role in maintaining the “health” of these ecosystems, as do the molluscs). Perhaps more importantly for these species, they are also indicators of water quality, an aspect of natural capital that concerns us all.

The authors of the European Red List of Bees are to be congratulated on a fine piece of work that makes a major contribution to our understanding of pollinator conservation, and is timely, coming soon after the publication of the National Pollinator Strategy for England.  However there’s still a lot of work to do to fill in the gaps for species that are Data Deficient and to understand the more detailed population trends, which are unknown for almost 80% of the bee species.

One of the most surprising findings, though, is that the honey bee (Apis mellifera), the most intensively researched pollinating insect on the planet, is considered Data Deficient “until further research enables us to differentiate between wild and non-wild colonies in order to determine the conservation status of the species in the wild.”  That’s an interesting state of affairs!

Full citation:

Nieto, A., Roberts, S.P.M., Kemp, J., Rasmont, P., Kuhlmann, M., García Criado, M., Biesmeijer, J.C., Bogusch, P., Dathe, H.H., De la Rúa, P., De Meulemeester, T., Dehon, M., Dewulf, A., Ortiz-Sánchez, F.J., Lhomme, P., Pauly, A., Potts, S.G., Praz, C., Quaranta, M., Radchenko, V.G., Scheuchl, E., Smit, J., Straka, J., Terzo, M., Tomozii, B., Window, J. and Michez, D. 2014. European Red List of bees. Luxembourg: Publication Office of the European Union.

How do animals respond to solar eclipses? Please share your observations.

P1120154

If you have been anywhere in the Palearctic during the past 48 hours then you can’t have missed the fact that we experienced that most rare of astronomical phenomena, a solar eclipse.  The eclipse was total only as far north as the Faroe Islands and Svalbard; further south it was partial and here in Northampton the eclipse was perhaps 80-90% total.

It’s been big news with lots of public interest.  As well as explaining the astronomy of eclipses, various commentators on current affairs and science programmes have talked about how animals respond to eclipses.  This is a topic that’s intrigued me ever since the August 1999 eclipse.  During that event I was carrying out field work in a Northampton grassland and as the eclipse reached its maximum the bumblebees and butterflies on the site stopped flying and foraging, and settled into the grass.  Once the eclipse had passed they carried on as before.  I don’t have any hard data to demonstrate the effect, it was purely an observation of what was happening around me.

Since then I’ve waited over 15 years for the next opportunity to observe how solar eclipses affect animal behaviour.  Unfortunately there are few pollinators flying at the moment so I had to content myself with watching the gulls, woodpigeons, carrion crows and other birds on the Racecourse park adjacent to the university.

P1120144

This time I took some video footage before, during and after the eclipse, noted the birds’ behaviour, flying, calls and singing.  And guess what? As far as I could tell the eclipse had no effect on the birds!  They behaved as if nothing was happening.  Even a mistle thrush than had been singing all morning from a perch in one of the boundary lime trees continued its song as the moon passed in front of the sun.

That really surprised me!  I was expecting the birds to at least reduce their activity as has been noted in previous eclipses.  But they didn’t as far as I could tell.  Perhaps it was the type of birds I was observing?  Or the time of year?  Or the fact that the eclipse was only partial?  Lots of questions but it’s difficult to do repeat observations for this kind of science – the next British total eclipse is not until 2090!

What did you see?  Did you notice any effect of the eclipse on animal behaviour?  Or did you, like me, see no effect of the eclipse.  I’d be interested to hear your observations.

P1120136

Something for the weekend #3

The latest in a regular series of posts to biodiversity-related* items that have caught my attention during the week:


  • A new report by WWF documents over 1000 new species discovered in Papua New Guinea between 1998 and 2008, and the risks to their survival from logging and other human activities.


  • How does history inform ecological restoration?  Ian Lunt has a great post on this topic.


  • In the latest in a series of high-profile rewilding initiatives, the conservation charity Lynx UK Trust has launched a survey to elicit public views on their proposal to reintroduce these large cats – make your views known here.


  • The University of Northampton’s annual Images of Research exhibition is available to view online and you can vote for your favourite three images.  Now I’m not saying that you should vote for “An ecosystem in a cup”.  But you could.  If you wanted to.


  • Staying with the University of Northampton, the Press Office has made me the first Staff Blogger of the Month.  Which is nice.  Not sure exactly how many other staff blog, but my impression is that it’s not many so it may be only a matter of time before I’m honoured again.  I thought I’d share what I wrote when asked about why I blog:

“Why do I blog? The main aim is to communicate the science relating to the importance of biodiversity and ecosystem services (and therefore why we need to conserve species and habitats) to as wide an audience as possible, including the general public, students, non-governmental organisations, businesses, and policy makers, as well as other academics.  Some of that communication relates to examples from our own research, and I also draw on the work of others in the field.  A secondary aim is to give my students a flavour of what it is that I actually do in the rest of my job: teaching is only part of the story!”


  • All of which links nicely to the recent post by Jeremy Fox, and subsequent discussion, over at Dynamic Ecology about whether science blogging (and specifically “ecology” blogs, whatever they might be) is on the decline.  For what it’s worth, I don’t think it is and I also think that the definition of what “ecology” blogging actually covers is much wider than the discussion suggests.


Feel free to recommend links that have caught your eye.

*Disclaimer: may sometimes contain non-biodiversity-related links.

What Einstein didn’t say about bees – UPDATE – May 2021

https://i0.wp.com/www.impawards.com/intl/misc/2012/thumbs/sq_more_than_honey.jpg

It’s more than 6 years (!) since I wrote this post. Over that period I’ve been asked many times about the Einstein bee quote and I’ve always replied that it’s made up, and that further more, Einstein was a physicist: he had no interest in bees!

Turns out, that’s not quite correct. There’s still no evidence that Einstein stated the infamous bee quote; however he does seem to have had an interest in bees. A newly-discovered letter from the great man mentions his admiration of the work of Karl von Frisch, whose research on the honey bee ‘waggle dance’ earned him a Nobel Prize. There’s a couple of news stories online about this: here’s one from Cosmos, and another from The Conversation. The original paper discussing the letter, by Adrian Dyer and colleagues, can be viewed here.

So I will have to moderate my response in the future, but it doesn’t change the big picture: Einstein never said it!

———————————————————————————————————————–

In the 100th anniversary year since Albert Einstein published the paper on his General Theory of Relativity, it’s saddening to think that one of the things that he will be best remembered for is something he did not say.  There are various versions of it, but they all amount to the same thing:

“If the bee disappeared off the surface of the globe, then man would have only four years of life left. No more bees, no more pollination, no more plants, no more animals, no more man.”

This statement could be dissected and disproved in numerous ways:  for example, there’s over 20,000 species of bees, so what is “the bee”?  Plus most of our crops are not bee (or even insect) pollinated, they are wind pollinated grasses such as wheat and rice.  Etc. etc.

But what is particularly annoying about it is – EINSTEIN NEVER SAID IT!  As far as anyone is aware he had no interest in bees whatsoever and the original source was a Canadian beekeepers’ journal in the 1940s.

It’s even more annoying that, despite the fact that we’ve known the statement is both factually incorrect and not by the great man, documentary film makers and journalists are STILL using it to support their work.  The latest example I’ve seen is this documentary, the poster of which is shown above.

Rant over: back to reading paperwork for a meeting this afternoon.

UPDATE:  I’d forgotten that Tom Breeze at University of Reading posted a fuller account of Einstein’s (non) quote last year – here’s the link.

Something for the weekend #2

The second in a regular series of posts to biodiversity-related* items that have caught my attention during the week**.


  • If you’d like to help raise money for bird conservation projects, please consider sponsoring Northants County Bird Recorder Mike Alibone’s team in the Champions of the Flyway event


  • Finally, if you’re the only person on the planet who has not seen a weasel riding on the back of a woodpecker, would you like to?  Of course you would!
*Disclaimer: may sometimes contain non-biodiversity-related links.
**Feel free to recommend links that have caught your eye.

Monitoring the biodiversity impact of the new Waterside Campus

Waterside winter 2014-15 - 2

All human activities can potentially have an impact on the biodiversity of the local environment in which they occur.  That impact can be positive or negative, depending upon how the activity is managed, how impact is mitigated, and the metrics that we use to measure the effects that are occurring.  This is particularly true of large infrastructure developments such as big buildings,  housing developments, roads, and, a category close to home for me at the moment, new university campuses.

I’ve written before about the University of Northampton’s plans to build the new Waterside Campus on brownfield land close to the River Nene, here and here.  It’s a huge project, likely to cost in excess of £330 million on a site covering about 20 hectares.

As you might imagine, such an ambitious scheme has not been without its controversies and there is much debate within the university about changes to how we work and interact with colleagues and students, provision of teaching and research spaces, etc.  There’s also been much discussion within the town, though the general feeling amongst the public (as far as I perceive it) is that bringing the university closer to the centre of Northampton will provide a much-needed economic boost and add significantly to the town’s life.

But what effect will such a development have on the wildlife in and around this peri-urban site, given that it’s in the middle of the Nene Valley Nature Improvement Area and very close to internationally important bird sites?

Over the past few months, together with my colleague Dr Janet Jackson, I’ve been taking part in meetings with the Waterside project’s landscape architects (LUC), other partners from the NIA project board, and the local Wildlife Trust. We’ve been discussing the current plans for the green infrastructure of the campus and thinking about how these can be enhanced.  It’s been a fascinating process as initial disagreements have been negotiated towards compromises and additions that everyone is happy with, balancing budgetary, function and space restrictions with habitat creation and landscape enhancement.

There’s too much been discussed to give a full account at this stage, and it’s possible that some details will change over time, but  the current Ecology Strategy document produced by LUC shows that there will be more than 10 hectares of habitat creation on the site, including species-rich grassland, woodland patches, brown and green roofs, swales and damp areas, and recreated brownfield habitat.  The latter is particularly exciting and something of an experiment, as much of the (albeit limited) current wildlife interest on the site relates to the brownfield element, including the “urban tundra“.

P1100110

To put the 10 hectares into perspective, the adjacent Wildlife Trust Local Nature Reserve of Barnes Meadow is only 20 hectares in area, so it’s potentially increasing that site by 50%.  It’s rare for academic ecologists such as Janet and myself to be able to influence large building developments, so this has been an exciting opportunity for us to make a contribution that (if all goes to plan) will have a positive effect on biodiversity conservation in the Nene Valley.

But how will we know if the Great Waterside Experiment has been a success and that the biodiversity of the new campus is at least as rich, and preferably richer, in species than it was before building took place?

Monitoring of the wildlife is key to this.  Fortunately we have some base-line surveys of birds, plants and invertebrates (including bees and butterflies) from before building started that we can compare with later surveys during and after the campus build.  That process has already started, and with my colleague Dr Duncan McCollin and with two keen second-year students, Jo and Charlie, we have already completed three winter bird surveys to get a sense of how the current site clearance and ground works is affecting the presence of birds in and around the development, including those using the River Nene.  The plan is to continue these surveys up to and after the campus opens in 2018, to give us a data series showing the influence of the campus on bird diversity and numbers.

The initial results are currently being analysed and it appears that the current phase of building has reduced overall bird diversity by about 30%, and that red and amber status birds (of most conservation concern) have been affected more than green status birds, as this figure demonstrates (click on it for a closer view):

Waterside bird surveys

These rough figures hide a lot of detail, however.  For example, there has been some addition of species in 2014-15 that were not recorded in 2012-13, including Coot, Treecreeper and the amber-status Stock dove.  More importantly, some of the amber status birds that we didn’t record on site in 2014-15, we know from additional surveys are still present in habitats within 500 metres of the development, for example Dunnock, Green woodpecker, and Bullfinch.  Similarly, red status birds such as resident Starling, and winter migrant Fieldfare and Redwing occur within at least one kilometre of the site.  Hopefully as the building work progresses towards completion these (and other) species will return, so at the moment we’re not too concerned by their disappearance from the site.

Later in the spring we will conduct a couple of breeding bird surveys, and continue surveying for the next few years until the campus opens in 2018.  Only then will we see exactly how successful our influence has been.  In the mean time I’ll report back as and when we have more data to share.

Waterside winter 2014-15


Clever crows!

Clever crows

Back in October I was staring out of the window of the office that I share with my colleagues, something I often do when I’m pondering a question or trying to add a tick to our “Birds Seen Out of the Window” list*, when I spotted something odd.  A pair of crows had focused their attention on a brown patch of lawn and appeared to be eating the grass.  I’m not much of a birder but I do know enough about crows to realise that grass is not a regular feature of their diet.  The same behaviour was observed a few other times after that, and on other occasions magpies were seen doing the same thing.  What could be going on?

Once I’d taken a closer look at the patch of dead grass the explanation was clear.  During our first year undergraduate induction week about a month earlier there had been a barbeque set up on that spot which had leaked hot fat onto the grass.  What the birds were eating was dead grass coated in lard, a useful source of fat to store for the cold conditions of the oncoming winter.

That’s one of things I love about urban birds such as corvids and gulls: they are adaptable and will exploit any resource that becomes available.  But how had they located the patch of fatty grass?  Were they simply exploring the lawn and stumbled across it by accident?  Seems plausible especially as they often feed on earthworms on the adjacent parkland.  Could they smell it?  The acuity of birds’ sense of smell has been the topic of considerable debate, but that’s certainly a possibility.

I was reminded to post this (originally half-written before Christmas) by a story on the BBC news website this morning about a young girl in the USA who receives gifts from the crows in her garden.  If you’ve not read it, please do: it’s a wonderful example of positive interactions between humans and the rest of biodiversity.

Crows (and other corvids) get a bad press, being often described as “evil” (surely a term that only applies to humans) and blamed for the demise of “nicer” birds – a reputation that is not completely justified, as a recent post on Kaeli Swift’s crow research site demonstrates.

So, learn to appreciate (even love) the crows in your local neighborhood; they will reward you with some entertainment as you watch their behaviour, if not necessarily with gifts.


*currently standing at 19 species and rising every month.

Building a blog readership takes time

Blog stats figure

This morning I had a very constructive meeting with some colleagues to discuss setting up a new blog/podcast series for the university.  It reminded me that I wanted to post something about how long it takes to build up a blog readership , specifically in the sciences.  The figure above shows the monthly number of views of my blog from its inception in March 2012 up to January 2015.  The line is a second-order polynomial, just to aid interpretation rather than to make any kind of statistical inference.

For the first year and a half of the blog’s life, monthly views were typically in the range 200-400, occasionally getting as high as 600.  Only after that was there a trend of increasing numbers month-on-month, but even that was not consistent, with some periods of low readership.  In part this relates to how frequently one blogs: more frequent = more monthly views, and I have been posting more often of late.  But that’s only part of the story and the figure also demonstrates that it takes time to build a readership for a blog.  For example, 4 posts in March 2012 attracted 402 views; the same number of posts in April 2014 received 1,469 views, and 2,120 in December 2014.

A lot of scientists (particularly early career) are starting to blog, sometimes because they think it’s the right thing to do: they see others doing it, and it’s encouraged by funding agencies, etc.  Sometimes these blogs are very successful; other times they falter after a few posts, perhaps because the writer loses interest.  I’m not in a position to offer much advice about blogging as I’ve only my own experience on which to draw, but I would say that it requires persistence: don’t assume that you’re going to get a big audience from the start, it takes time to build a readership.

Evolving a naturalist – happy birthday to me!

Jeff in the tee-pee

Somehow, today is my 50th birthday.  So I thought I’d mark it with a short post about my personal evolution as a naturalist and, ultimately, professional scientist.

One of the great things about the internet and social media such as Facebook is that you can make exciting discoveries on a weekly basis.  Recently I found out something that means a lot to me on a very personal level: I discovered that a family* who lived in the same street when I was growing up in Sunderland in the 60s and 70s have digitised some old home movies and made them available on YouTube.  In our digital age in which every phone and camera can capture and share events as they happen, it’s sometimes easy to forget that owning a movie camera in the 60s was quite a rarity and the majority of kids living at that time were never filmed.   

These movies are exciting not just because one of them shows me aged about 5 years (in the blue shirt) playing with friends (I’m there from 3’53”) but because it documents, in colour and moving pictures, one of the reasons why I became a professional naturalist with a deep fascination for biodiversity. 

The grassland in which we are erecting a tee-pee is not some country meadow, the kind of wild rural landscape cited by so many other naturalists as inspiring their childhood fascination with natural history.  These grasslands had arisen spontaneously on cleared demolition sites, following the removal of Victorian terraced housing and tenement blocks, some of which were slums and others that had suffered bomb damage in the Second World War (now that does make me sound old!)

Up until the 1950s this area had been very built up, with the houses, shops and pubs serving the local families who were employed mainly in the shipyards and coal mines to the north of the town.  You can get a sense of how urban it was from this 1898 map of Southwick; the places I refer to are just south-west of The Green to the left of the map. 

Following demolition the sites were left to their own ends, and were colonised by plants, insects, birds and mammals from patches of habitat closer to the river that had either been cleared of buildings earlier in the century, or which had never been built upon at all.  There are some nice areas of magnesian limestone grassland nearby along the higher banks of the River Wear valley, and typical calcicole plants such as Greater Knapweed (Centaurea scabiosa) could be found on these post-demolition grasslands.  In fact, in the absence of horse chestnut trees, we used to play a version of conkers using the unripe seed heads of Greater Knapweed.  Was that an echo of earlier children’s games in Britain, prior to the introduction of horse chestnuts in the 17th century?  Apparently similar games were played with snail shells and hazelnuts.  

If you watch the opening minute of this piece of footage from the same series, and ignore the girls posing and playing in the foreground, the background reveals a rich flora of plants, with butterflies hopping between flowers.  The first bird species that I can remember identifying, and being fascinated by its bright colours, was Goldfinch (Carduelis carduelis) feeding on the seeds of tall thistles in the very area where this was filmed.   The first butterfly that I could put a name to was the Small Tortoiseshell (Aglais urticae), also feeding on thistles, but this time on the nectar-rich flower heads, as a pollinator.  We’d collect its caterpillars from the nearby nettles and raise them in jars.

So you don’t have to have had a rural upbringing to appreciate and benefit from nature, and to later influence your profession and passions, any piece of land can inspire interest in kids, regardless of its origin, if nature is left to colonise. Unmanaged, semi-wild green space within towns and cities has huge value, both for wildlife and for the culture of childhood.  They need to be protected just as much as rural nature reserves, including the generally disparaged but actually biodiverse “brownfield” sites, as Sarah Arnold has discussed in a recent blog post.

Some of the riverside grasslands still remain and I hope that they are fascinating new generations of kids with their colour and diversity and flouncing butterflies. But the post-industrial grasslands on which I played and looked for bugs and flowers are all gone; they were cleared and built upon in a flurry of housing and retail development in the 1980s.  Perhaps in the future they may return if those buildings are themselves demolished and the land allowed to lie undisturbed for a while.  That is what nature does: it ebbs and flows across our landscapes in response to human, and natural, interventions, endlessly changing and endlessly fascinating to the curious minds of children and scientists, no matter how old they are.


*My sincere thanks to the Scrafton family who took the original footage, made it available on YouTube, and gave me permission to use it in this post.

Data I’ll never publish 1: flower production and plant size in Lotus corniculatus

Lotus flower production graph 1991

For reasons that will become obvious next week, I’ve been in a reflective mood recently and this first in an occasional series of posts about “data I will never publish” is one of the results of that reflection.

When scientists have been doing research for a few years, most of them start accumulating a back-log of data.  In some cases this is data that may be published in the future (for ecologists that means long-term data sets, which I’ve talked about before) but other data may be fragmentary or simply too limited to be publishable.  Good data are hard won and I never, ever discard data: you never know when it may come in useful.  So in this series I will present such scraps of data that I know I’ll (probably) never publish.  Their purpose is to illustrate interesting points, to stimulate discussion and ideas, and hopefully they might even be of use to other researchers in one way or another (I’m happy to share the raw data, just drop me a line).

This first data set was collected in the grasslands of Wytham Woods in 1991 when I was a research student.  It subsequently ended up being used in my PhD thesis and in one of the papers that resulted from it (Ollerton & Lack 1998) but not quite in this form, rather embedded within larger analyses.  The graph above (click on it for a more detailed view) shows the relationship between individual plant size (measured using a calibrated non-destructive biomass index that I developed) and total flower production for that year, in the plant species Lotus corniculatus (Fabaceae), commonly known as bird’s-foot trefoil.

This plant is a herbaceous perennial grassland species which can live for quite a long time (at least 50 years).   The data show that plant size and flower production can span 5 orders of magnitude – the maximum number of flowers produced in one year by a single plant in this population was over 13,000, which is astonishing for a low-growing grassland species!

I’ve used this figure in undergraduate lectures as it illustrates several important points about many plants:

  • in theory, there is no upper limit to the potential maximum size of plants.  As long as they have appropriate growing conditions and are not limited by weather or disease or herbivory, they will continue growing.  That’s because they are modular, constructed of iterations of basic units of the plant “body”, and show indeterminate growth.
  • likewise, there is no upper limit to the number of flowers that can be produced because each modular unit can itself produce one or more flowers.
  • plants can be very plastic in their response to the environment.  The data form two clusters; the lower one (smaller plants) is from a sub-population that grew in a grassland that had never been fertilised.  The upper cluster (larger plants) grew in an adjacent area that had previously been an arable field and in which there were still fertiliser residues present in the soil.  The smaller plants are likely to have been older than the larger plants, but the latter had more soil nutrients on which to draw.

The following graph illustrates the same plants but this time it’s the relationship between biomass and number of seed pods produced.  Still a linear relationship with no sign of a plateau; female reproduction in these plants just goes on and on (as, of course, does male function via pollen dispersal.

Lotus seed pod production graph 1991

This is one of the things that I love about plants: they are so flexible in their response to growing conditions!