Author Archives: Jeff Ollerton

Unknown's avatar

About Jeff Ollerton

Independent consulting scientist and author, working on understanding and conserving biodiversity

Big Garden Birdwatch this weekend

2014-11-06 14.00.17

This weekend the RSPB will be running its annual Big Garden Birdwatch, a great example of citizen science in support of biodiversity monitoring.  No matter where your garden is or how small it might be, if you have time, please do get involved.  Even a return of zero birds is useful information because it tells us where birds are not occurring.

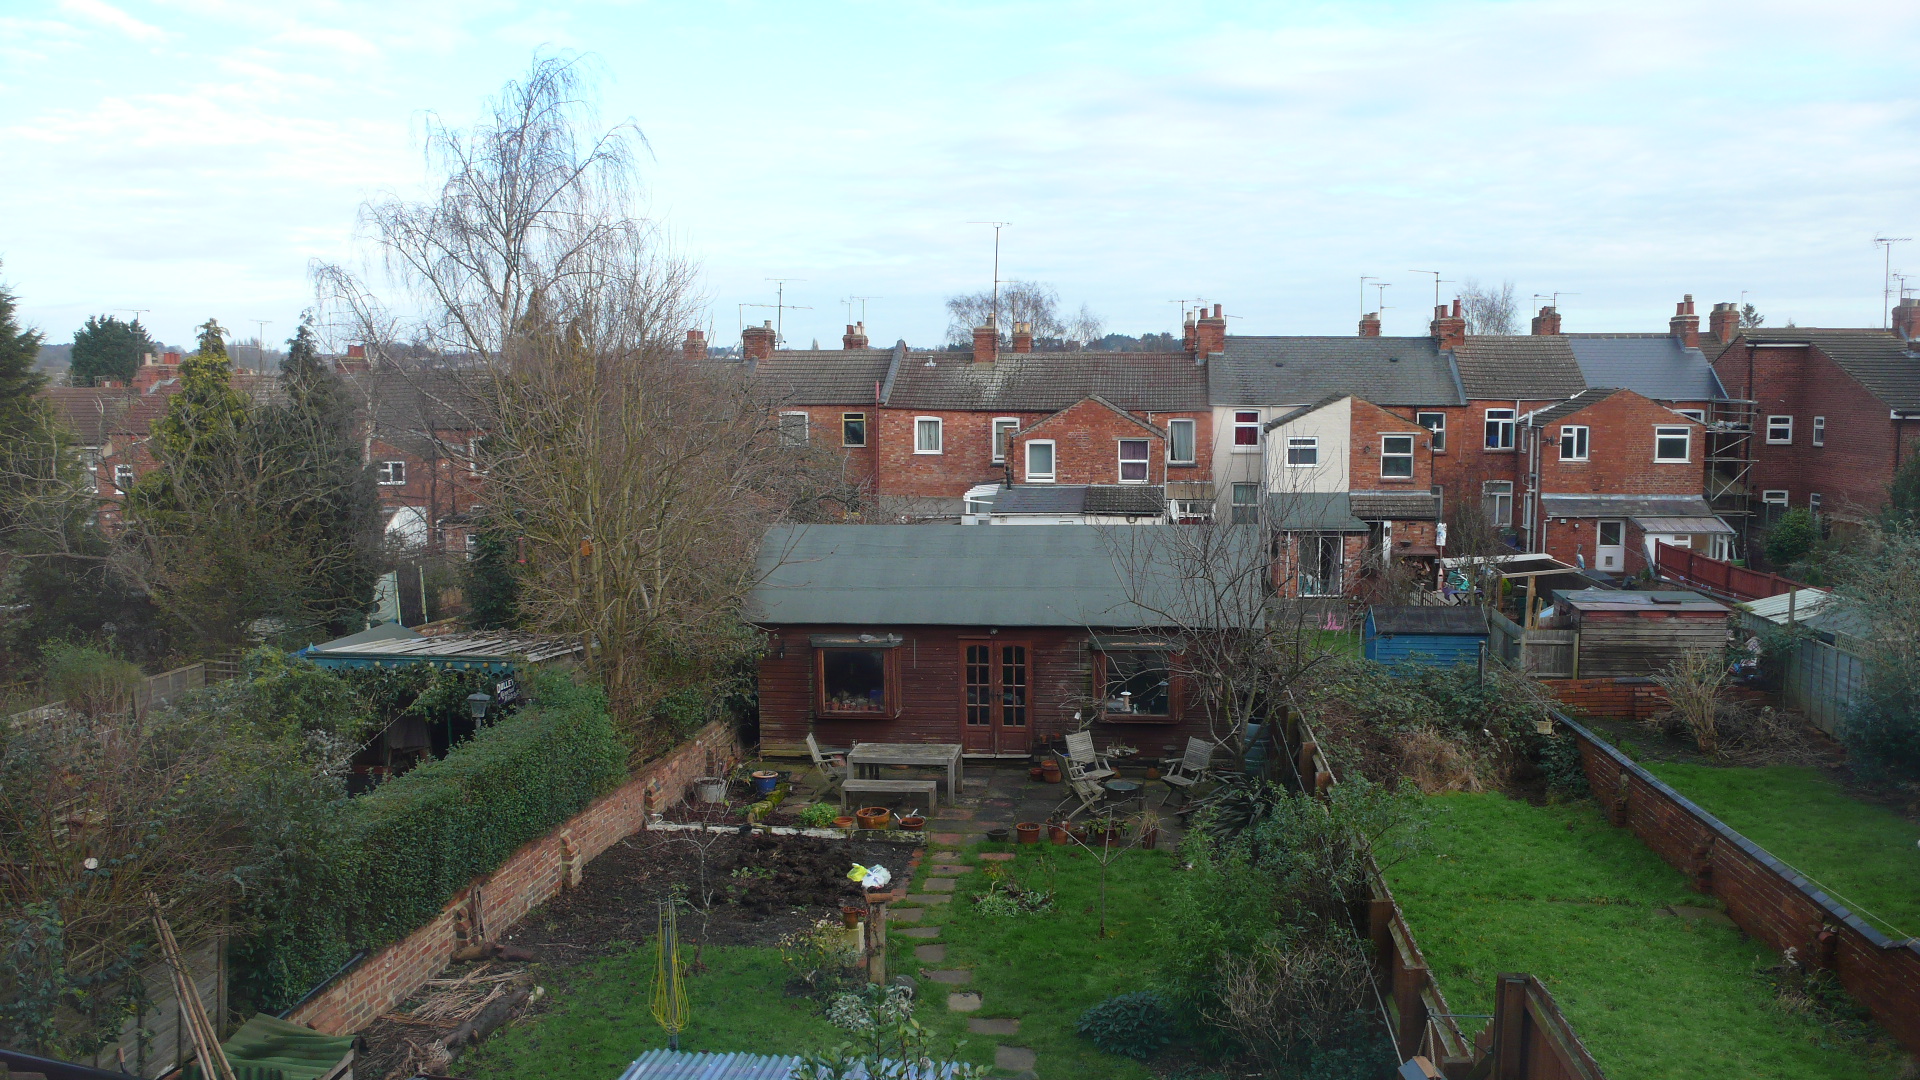
As I have for the past couple of years since we moved into this house, I’ll do my hour of watching on Sunday morning from the bedroom window.  Hopefully the current cold weather will persist and bring birds into the garden that are normally found out in the wider countryside.

Happy birding!

Garden chickens and biodiversity – some thoughts

2014-05-01 15.58.49

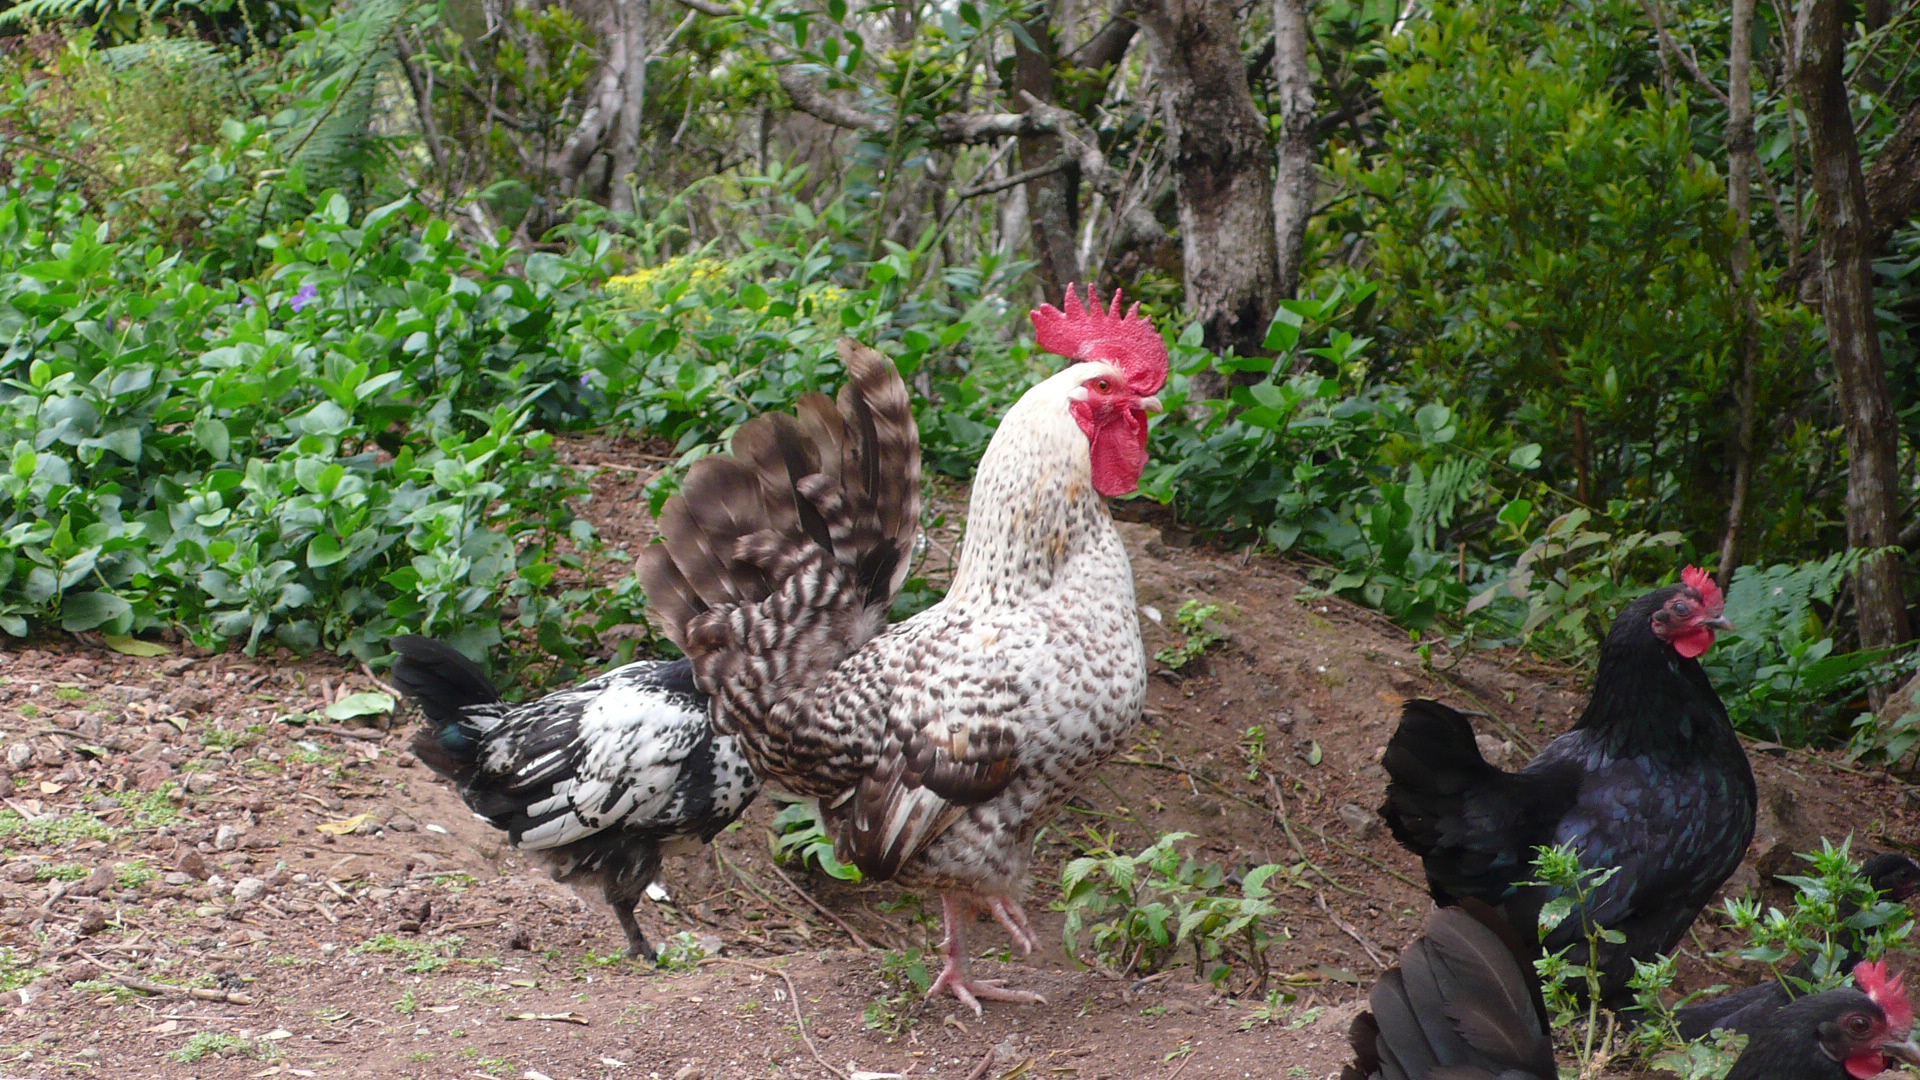
Keeping chickens as a hobby is very popular at the moment and many gardeners are finding space for a few chooks in their own patch.  It’s been particularly trendy amongst urban gardeners, ourselves included: we have a run with 6 hens that make us self sufficient in eggs and chicken shit (the latter a vital addition to our soil’s fertility).  They are also fascinating, relaxing animals to watch as they go about their chickeny business of scratching, pecking, clucking, and dust bathing.  They are intelligent, social, inquisitive birds, that I’d recommend to anyone who has the space to accommodate a decent sized run and (importantly) the time to look after them.

There are plenty of magazines, books and websites offering advice on keeping hens on a small scale.  One of the most active and interesting blogs is The Garden Smallholder which generally has some good advice and ideas.  Back in November, however, a post about preparing a new kitchen garden caught my attention, specifically the fact that the writer’s chickens were let out onto the plot and that:

Chickens are great at scratching and turning over soil with their enthusiastic feet, and excellent pest control too

Let’s think about that last point, that chickens provide “excellent pest control”.  It’s a statement that I’ve seen repeated many times in books and articles, and it usually doesn’t solicit any comments.  But the logic behind it is that hens can differentiate between “pests” and “non-pests” in a garden, that they will gobble up the slugs and cutworms, leaving behind the worms, beetles, spiders, and other beneficial (or neutral) invertebrates.  This is nonsense, of course: chickens will eat anything they find and do not differentiate between the different elements of soil biodiversity*.

For this reason we don’t allow our hens to free range on our vegetable patch: we want to keep the soil’s fauna intact, allowing the earthworms to aerate and turn over the soil, let the beetles eat the slugs, give ground-nesting bees some space in which to live, and so forth.  A few weeks of digging with chickens present would destroy all of that.

The vast majority of invertebrates that live in the soil are not pests and a significant  proportion are certainly good for our gardens (particularly the earthworms and carnivorous beetles).  Allowing your chickens to feed freely on these animals will significantly reduce your soil biodiversity, which is a bad thing in its own right (if we accept that these animals are a measure of your soil’s “health” and productivity), and could reduce the numbers of invertebrate-eating wildlife, such as thrushes, hedgehogs and toads, visiting your garden.

If you want your chickens to eat garden pests my advice would be to take the pests to them: scoop up several slugs with a trowel, throw them into their run, and watch the birds excitedly scramble for their treat.  But remember that slugs play a positive role in the garden too, demolishing huge amounts of garden waste in compost bins and (in our garden) eating up cat shit.  That’s a topic for a future post though.


*I made a comment to this effect on the Garden Smallholder post but the blog owner saw fit not to allow it to appear.  Draw your own conclusions from that.

What do academics do once the research is published?

P1010513

At the University of Northampton we run a programme of generic training workshops aimed at research students (MPhil and PhD) from across all disciplines.  I contribute to several, including one called “Getting Published”, usually run with my colleague Professor Ian Livingstone.  This focuses on academic papers/articles (phraseology varies with subject) and covers all of what you might expect such a workshop to feature, including asking about motivations for wanting to publish research*, when is the right time to publish your research**, issues about co-authorship***, and so forth.

One of the key aspects of the workshop is a flow chart of the process of getting published, beginning at “do the research”, moving on to writing it up, choosing a journal, submitting to a journal, peer review, dealing with reviewers’ comments, writing a covering letter, coping with rejection, re-submission to the same or a different journal, celebrating acceptance, etc.  All fairly standard stuff.

By this point we’re about three-quarters of the way through the workshop, so I ask a question:

“OK, you’ve gone through the whole process (which can take anything from months to years) and your paper has been published.  You’re very pleased, of course.  What do you do next?”

Responses at this point are typically a blank expression, or perhaps “What else is there to do?  The paper’s published, we’ve done our job.  Move on to the next”.  In other words, the general feeling seems to be that the process stops when the research is published.  I politely suggest that this is not so, that you’re still only part-way through the process, and explain why, starting with this table:

Clinical:                                  48.9%

Biological Sciences:           37.8%

Environment:                       37.3%

Physical Sciences:              42.3%

Social Sciences:                   55.4%

Business:                                57.2%

Humanities:                          77.5%

These figures are the percentages of un-cited research papers (in 2005, by broad discipline) published in the UK for the period 2000 to 2004.   The total number of un-cited papers is 122,771****.  There are other similar statistics available, some with broader time windows, but they all point to the same conclusion: in all disciplines, a high proportion of research papers are never referred to by other researchers in the field.  And in some disciplines it’s the majority of papers.

That’s not to say that the research is no good, or even that it’s not being read, but it’s certainly not being cited.  Citation is not the only measure of the “quality” of a piece of work of course, but it at least indicates that peers have read the work, and citation is central to a range of widely used metrics, including the h-index.

This usually comes as a shock to the postgrads, as it does to many established academics!  The low average citation rate of papers is mainly a response to the sheer volume of research currently being published, as I’ve discussed previously in relation to the field of pollination ecology.

How do researchers in a field decide which papers they are going to read and/or cite, and which they ignore?  It’s been suggested that academics often have quite conservative citing patterns, referring again and again to the same work or authors in their own papers.  How can a researcher break through this conservatism and have their own work cited?

One answer is to promote your work after it’s published and the workshop offers some ideas on how to do this:

  • Send PDFs of your papers to other researchers, whether you know them personally or not.  I’m always happy to receive copies of papers that I might otherwise miss.
  • Deposit copies with your institutional electronic repository (at Northampton that’s NECTAR)
  • Tell the world about it using social media, either general (Twitter, Facebook, LinkedIn) or academic (ResearchGate, academia.edu)
  • Send announcements to email discussion groups in your field
  • If you blog, write a post about it (as I did for the pollinator extinctions paper last month)
  • If the work is particularly novel/important/high impact, consider writing a press release with your institution’s press office, or at least a news item on the website.
  • Consider writing up your research as a non-academic piece in a magazine or newspaper for a wider, public audience (see comment below)
  • Present the work (and cite it) at conferences & seminars (the old fashioned way…..)

This kind of “self promotion” is anathema to some academics, for reasons that are not clear to me but may relate to misguided notions about sullying the purity of their work with grubby advertising, something that’s been discussed over at the Dynamic Ecology blog.

But if you don’t promote your work, no one else will do it for you!  Doing research and writing books and papers is a creative endeavour just as much as any of the arts or music.  Would we expect an artist to not advertise the work they do?  Or a musician to keep compositions to themselves.  No, they have exhibitions and concerts, and use advertising in all its forms, to promote their work.

Ultimately a piece of research is only as good as its reception by the audience at which it’s aimed: some brilliant research findings have been ignored for decades because it had disappeared into academic obscurity.  This is likely to happen even more in the future, I’d suggest, given the amount of work that’s being published.

Do you have other strategies for promoting your work?  Or do you disagree with some of what I’ve said?  Feel free to comment, I’d be happy to hear from you.

*”earning money” occasionally pops up as a (naive) reason, so we have to point out that academics rarely get paid for their academic publishing, other than (meagre) book royalties.

**As soon as is feasible, even if it’s a short literature review.

***Make sure everyone, especially supervisors, is clear about which work will be co-authored, which will not, and why.

****Source: PSA target metrics for the UK research base, Office of Science and Technology, DTI (2005)

Did you remember to thank the insects for Christmas?

2013-12-23 11.44.27

This year I decided not to re-post my traditional “Thank the insects for Christmas” piece, in part because I don’t want to bore the good readers of this blog with too much repetition, but also because the idea has been taken up by the Urban Pollinators Project at the University of Bristol, and developed into an infographic (on which I advised) that you can view here.  The BBC News Website used the information for a nice article called “The insects that made Christmas“.  So look back on your Christmas dinner, if you had one, and give thanks to the many invertebrates that made it happen!

The other reason for not doing a full re-post of that piece is that I was feeling worn out by a long university term that ended not with a whimper, but a stressful double-bang of publication of our pollinator extinctions paper (and the associated media interest, which I may talk about early in 2015) and the release of the results of the Research Excellence Framework, which I coordinated for my department.  We were pleased with the outcome, with over 40% of our research papers rated as “world leading” or “internationally excellent”, and most of the rest being “recognised internationally”.  For a young, mainly teaching-focused, non research-intensive institution such as the University of Northampton (which doesn’t enjoy the facilities and funding of older, larger universities), that’s an impressive result.

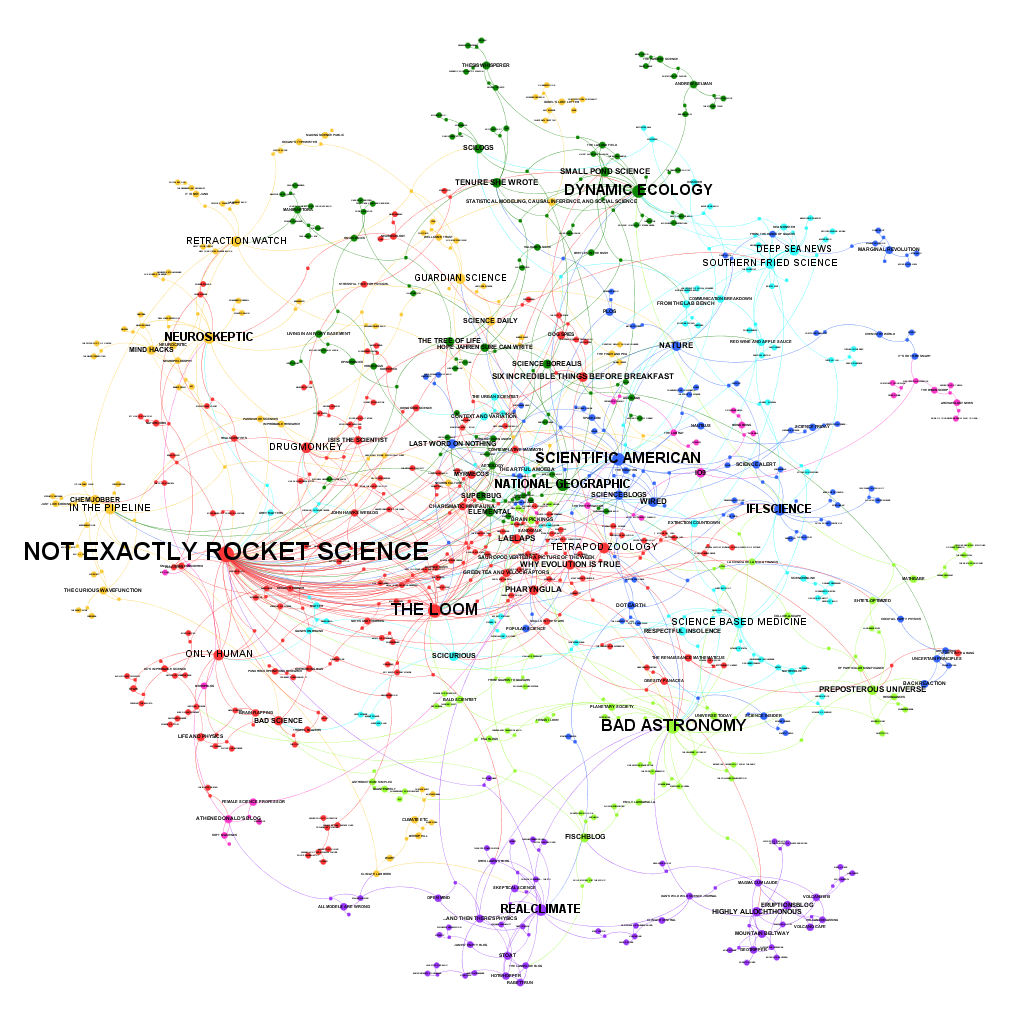
A final bit of news is that this blog made it onto the MySciBlog survey 2014, by Paige Brown Jarreau (Louisiana State University) who asked more than 600 science bloggers “to list up to the top three science blogs, other than their own, that they read on a regular basis”.  The initial results can be found at Figshare, and I’ve inserted network graphic below (click on it for a larger view).  The size of a node is proportional to the number of respondents who read that blog regularly and my blog is part of the green section near the top, tucked just under the dominant Dynamic Ecology.  It’s gratifying to know that other bloggers are reading this in significant numbers!

Thanks to everyone who has read my blog over the past year, particularly those who have commented on the ideas and information I’ve presented: best wishes to you all for 2015!

BlogsRead_ModularityClass3_InDegreeSize copy

A Christmas vignette (re-post from 2013)

P1110602

First posted Christmas 2013, I thought it was worth re-posting as it’s as resonant this year as last.

—————————————————————————————————————————

This afternoon I booked half a day’s leave to go into Northampton town centre to pick up some final Christmas gifts.  A crowd of shoppers in Abington Street was eager to lay their hands on the freebies being distributed by that traditional Yuletide apparition, The Coca Cola holidaysarecomingholidaysarecoming Big American Truck.  As red and shiny as Rudolf’s nose, it was pedalling its cheap brand of Christmas sentimentality to a willing audience.  

Shopping completed and daylight fading fast, I headed back to the multi-storey car park, again passing the Coca Cola queues, skirting them, determined not to be sucked in.

The car park was cold and ugly, as they tend to be.  But on the second floor, level with the bare crown of a tree that emerges from an adjacent pub garden, a mother and her young son stood.  Hands full of shopping bags, they had paused to listen to a male blackbird singing as the dusk drew in.  As I passed I heard them chatting about its song: both agreed it was beautiful.

Driving out of the car park I wound down my window: the blackbird was still singing.

I could give a very academic spin to this tale and talk about the cultural and spiritual ecosystem services that are provided by such birds, which nourish us in ways that no amount of corporate marketing ever could.  But I shan’t: it was a perfect Christmas vignette and a perfect contrast to the earlier soulless commerciality.  And that’s sufficient.

Extinction of British bees and flower-visiting wasps – a new assessment of rates and causes

Extinction of species is perhaps the most fundamental assault that we as humans can inflict on the rest of the natural world.  Extinctions take a range of forms, from the loss of a whole species (such as the sad case of the St Helena Giant Earwig, recently declared extinct by the IUCN), down to extirpation of local populations.

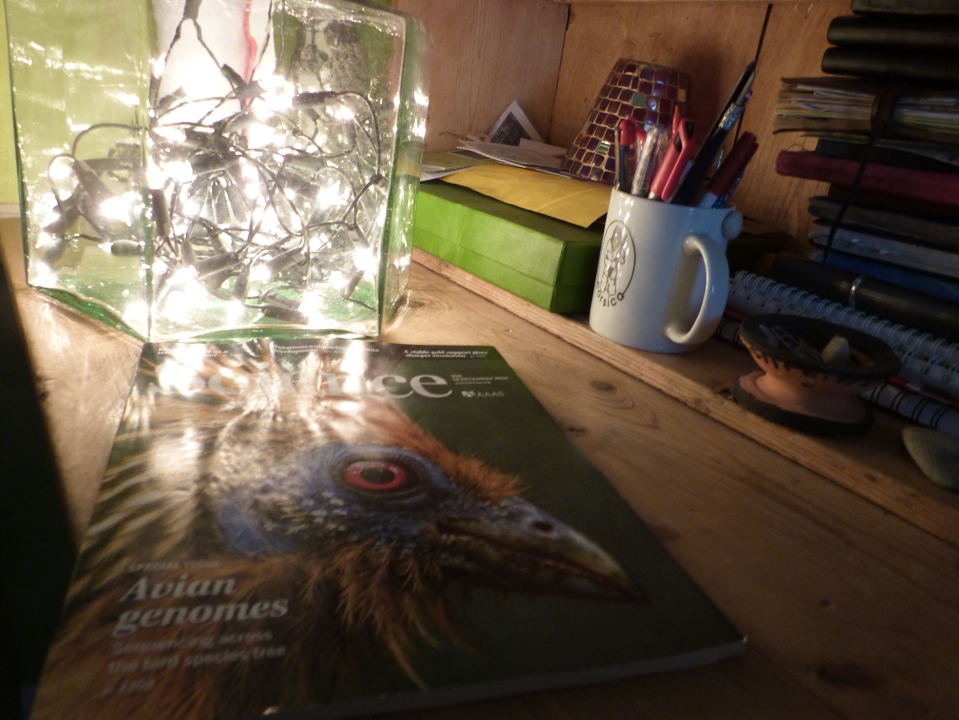
For an island nation such as Britain, extinctions at a country level are highly significant because there is limited opportunity for species to disperse across the sea and re-colonise areas where they previously lived.  In a new research paper published this week in the journal Science we have addressed the subject of pollinator declines in the UK and asked the following questions:

1.  How many bee and flower-visiting wasp species have gone extinct in the UK?

2.  Is the rate of extinction (e.g. number of species per decade) constant or variable over time?

3.  Can we interpret any patterns in relation to broader societal changes, for example in agricultural policy, conservation strategies, etc?

The research is a collaboration between myself and University of Northampton colleagues Dr Robin Crockett and Dr Hilary Erenler, together with Mike Edwards from the Bees, Wasps & Ants Recording Society (BWARS), the c. 500,000 records of which were used in these analyses.  This is probably the most extensive data set on these insects available for any country and an important resource.

The answer to the first question is that 23 species of bees and flower-visiting wasps have gone extinct, ranging in time from the crabronid wasp Lestica clypeata (last observed in 1853) to the solitary bee Andrena lathyri (not seen since 1990).  All of these species still occur on mainland Europe, so these were country-level extinctions, not species extinctions.

The answer to questions 2 and 3 is that the rate of extinction is highly variable, and by using a novel statistical approach adapted by Robin to analyse the changing rate over time, we found that the main period of species loss followed changes to agricultural policy and practice just after the First World War.  This is much earlier than previously believed: until now it has usually been the Second World War and the subsequent Common Agricultural Policy which have been seen as the main drivers of pollinator loss.  This figure produced by Robin shows the results in detail:

Figure 2 colour

The four periods marked in red are the points where we estimate the rate of extinction changed (with 99% confidence intervals shown in pink).  The most rapid rate of extinction (shown by the solid blue piecewise regression lines and dashed 99% confidence intervals) is from the late 1920s to the late 1950s.  This, we believe, is the cumulative effect of agricultural changes precipitated and then augmented by the First and the Second World Wars, respectively.

The period of extinction from the late 19th into the early 20th centuries was probably caused by increased import of South American guano as soil fertilizer which increased grass productivity at the expense of wild flower diversity.  This reduced reliance on strict rotational cropping, including fallow periods with nectar- and pollen-rich weeds, and N-fixing legume years.  However it was the invention of the Haber Process in 1909, allowing industrial manufacture of inorganic nitrogen fertilizers for the first time, that fundamentally affected British agriculture.

The slow down of the rate of extinction from the early 1960s to the mid 1980s is not easily explained given the continued intensification of farming, encouraged by Common Agricultural Policy subsidies.  It could be due to the most sensitive species having been already lost, or because of conservation initiatives including the establishment of more nature reserves by organisations such as the Wildlife Trusts and the RSPB, habitat restoration and management by groups such as the British Trust for Conservation Volunteers, more farmers going organic, etc.  Or it could be a combination of both, and/or factors we’ve not yet thought of.

The final period of extinctions from 1986 to 1994, where the rate seems to increase, could be seen as evidence against the slowing in the rate of decline of pollinators in north west Europe found by Carvalheiro et al. (2013).  However  we need to be cautious here as there’s a large confidence interval around the calculated extinction rate.  The four extinctions between 1988-1990 could be an isolated cluster, or the start of a further period of relatively high extinction rate.  Only time will tell!

Bees, wasps and other pollinating insects are absolutely vital to the functioning of our natural ecosystems and for a great many agricultural crops.  We’ve known for some time that these insects are declining in Britain but now we can see how historical agricultural changes have caused species to become extinct. The big question is whether these extinctions have stopped or whether they will continue in the future. The species that have been lost to Britain still survive on the Continent and there is the possibility of natural re-colonisation or artificial reintroduction, both of which have occurred in recent years.  However in order for this to be successful we must restore as much natural habitat as possible within our farmland, which after all covers some 70% of the British land surface.  The irony of our findings, of course, is that pollinators are vital for agriculture, as the UK Government’s National Pollinator Strategy recognises.

Studies such as this illustrates the importance of maintaining the year-on-year effort of recording natural history data – the research simply wouldn’t have been possible without the BWARS records, which are mainly collected by amateur naturalists.

The full citation for the paper is:  Ollerton, J., Erenler, H., Edwards, M. & Crockett, R. (2014) Extinctions of aculeate pollinators in Britain and the role of large-scale agricultural changes. Science 346:1360-1362.  I’m happy to send a PDF to anyone who requests a copy for personal use. 

Notes:

1.  We define “extinction” as ≥ 20 years since the last recorded occurrence of the species in Britain, which is why the data stop at 1994.

2.  We have excluded single early records of species that cannot be verified as representing stable breeding populations.

3. Analyses were performed using the ‘segmented’ library in R (www.r-project.org)

4.  Thanks to Robin Crockett for the figure and the analyses, and Hilary Erenler and Mike Edwards for their input into the study.

Winter visit to Wicken Fen

P1120027

If it’s winter, it must be time for the annual second year undergraduate field trip to Wicken Fen, a yearly pilgrimage that’s been run by my colleague Dr Janet Jackson for many years now.  The purpose of the trip is to show our ecology and environmental science students an example of large-scale habitat conservation and restoration in action, at one of England’s oldest nature reserves.  I try to go along and help out when I can, though I missed it last year because of my trip to Brazil.  It was more than a fair swap, though there’s something about Wicken’s stark winter beauty that always makes for a memorable day.

2014-12-05 12.07.59

The National Trusts’s nature reserve at Wicken Fen is one of the few remaining patches of the wetland habitat that once covered most of East Anglia.  There’s little of it left (less than 1% of the original area) but large-scale, long-term initiatives such as the Great Fen project and the Wicken Fen Vision are trying to increase this by restoring the farmland surrounding the remaining patches.  This is important landscape-scale conservation because the fenland habitat is rich in biodiversity.  Wicken Fen alone is reckoned to host more than 8,300 species of macro-organisms, most of which are invertebrates, including more than a thousand each of flies and beetles.  There’s also an impressive list of birds that use the site either for breeding or over-wintering, and on our day trip we managed to see 31 species*, highlights of which were a pair of Hen Harriers, a lone hunting Barn Owl at dusk, and a huge flock of Lapwing and Golden Plover that provided a backdrop to our guided tour.

P1120025

Another great highlight which impressed both students and staff was a close encounter with some Konik Polski ponies which were curious and friendly, and yet more or less wild, as they stay out on the Fen all year round with no shelter and the minimum of human intervention.

Konic ponies

Everyone was enchanted by these hardy little horses and it was a struggle to get the students to move on with the tour!

Konic ponies with Janet

As Carol Laidlaw, conservation grazing warden at Wicken Fen explained to us, these ponies, together with the tough highland cattle, are a vital part of Wicken Fen’s ecology.  Their grazing prevents woody plants from colonising, and this, together with their physical presence in the landscape, leaving hoof marks and dung piles, opens up both small patches and larger areas for colonisation by plants.  For anyone interested in reading more about the grazing animals I can recommend Carol’s excellent article on the project.

P1120033

Although the day was cold it was not the frozen landscape we normally encounter and there were even a few plants still in flower.  It’s been a mild winter so far – how long will that continue?  If you’ve never visited Wicken Fen I can recommend it as a day trip whatever the season or weather, there’s always fascinating wildlife to see.

2014-12-05 15.57.39

*Bird list for the trip was: Collared Dove, House Sparrow, Blackbird, Kestrel, Fieldfare, Goldfinch, Cormorant, Grey Heron, Magpie, Lapwing, Golden Plover, Carrion Crow, Snipe, Hen Harrier, Wigeon, Great Tit, Blue Tit, Feral Pigeon, Starling, Wood Pigeon, Robin, Chaffinch, Wren, Shoveler, Tufted Duck, Coot, Mallard, Common Gull, Herring Gull, Jackdaw, Barn Owl.  Plus chickens being kept in the garden of one of the local cottages!

Pollinator seminar at Westminster – the official version – and that 1,500 figure

20141028_180501

Last month I wrote a personal account of the National Pollinator Strategy Seminar held at Westminster.  This week the Parliamentary Office for Science and Technology released their official summary of the event plus PDFs of the slides of some of the participants.  They can be downloaded from this website.  It was an interesting seminar and it’s well worth taking time to study these documents; they are very accessible for the non-specialist.

One thing that’s unclear to me from this account is with regard to the statement that:  “there are approximately 1,500 insect species that pollinate food crops and wild plants, including bees, hoverflies, wasps, flies, butterflies, beetles and moths”.  The National Pollinator Strategy also cites that figure, though says “at least 1,500” species.

Where does the 1,500 figure come from?  Does anyone know the original citation?  I genuinely can’t recall if I’ve ever seen it published.

A quick back of the envelope, conservative calculation suggests to me that 1,500 species is too low:

Aculeates (bees plus wasps minus ants) =  500
Butterflies =     59
Macro-moths (assumed 50% flower visitors) =  400
Hoverflies =  250
Other flies (assumed 10% flower visitors) =  700
Beetles (assumed 5% flower visitors) =  200
Total species = 2109


Links are included to the sources of the original diversity figures.  I’ve rounded some of the figures down and the % flowers visitors figures for moths, flies and beetles is pure guestimate based on my field experience.  But they are not likely to be way out, and if anything could be an under-estimate for flies and beetles; moths could be too high, though most species do feed as adults.  Aculeate Hymenoptera (bees and wasps) could also be an over-estimate, but then that figure doesn’t include the non-aculeate “wasps” that frequently visit flowers, for example many ichneumonids and sawflies.

Does it matter?  I think so: as scientists it’s important that we provide the most accurate data that we can to governments and other bodies that may use it for policy, strategy and advocacy.

As always I’d be pleased to receive your comments.

Urban pollinators for urban agriculture (and horticulture!)

P1010430

Over the past few weeks I’ve been thinking a lot about urban pollinators, that is to say bees, hoverflies, butterflies, and other animals, living and foraging in towns and cities.  As I recounted in my recent post about the National Pollinator Strategy seminar at Westminster, Jane Memmott presented some of the first data from the Urban Pollinators Initiative which is looking very interesting.  At the same time, Muzafar Hussain has submitted the first manuscript from his PhD study of urban solitary bees in Northampton, and will hopefully be defending his thesis early next year.  More recently I was asked to examine the PhD thesis of  Rob Fowler at the University of Birmingham, whose focus has been on pollinators across an urban-rural gradient.  Rob did very well and I look forward to seeing his work published.

Interesting though all this work is, it’s largely being done outside the context of crop pollination per se, focusing mainly on the identity and abundance of these urban pollinators.  It’s timely, therefore that a study has just been published by Thebo et al. in the journal Environmental Research Letters entitled  “Global assessment of urban and peri-urban agriculture: irrigated and rainfed croplands” which gives the first comprehensive figures on the extent of agriculture in and around the world’s large towns and cities.  The paper is open-access so you can read its findings for yourself, but the main message is that urban agriculture is more extensive and important than previously assumed, and there are significant implications for food security and water resources.

The research has (justifiably) received quite a lot of publicity in the media, for example on the BBC News website, and is a great contribution to a still limited field of study.  One aspect jumped out at me though; when discussing the limitations of their methods the authors state that: “the scale and methods used……are not structured to capture very small, spatially dispersed areas of urban croplands”.  In other words, urban gardens and allotments are not included in this assessment.  In the UK at least this is a significant limitation as we know that urban fruit and vegetable growing is widespread, though as far as I’m aware there’s no published figures on the volume and value of this local horticulture of food crops.

Which brings us back to urban pollinators: a significant fraction of these crops (large-scale and local garden) requires pollination by insects.  As I reported back in July, in our own urban garden this includes at least 15 crops (strawberries, apples, greengages, cherries, blackcurrants, squashes, courgettes, blackberries, fennel, runner beans, french beans, passion fruit, tomatoes, raspberries, and radish pods).  An integrated study of urban agriculture/horticulture in the context of pollinator diversity and abundance would be a great piece of research and is long overdue.


Biodiversity conservation pays its way – Nature Improvement Areas are boosting wildlife, communities and economy

P1100101

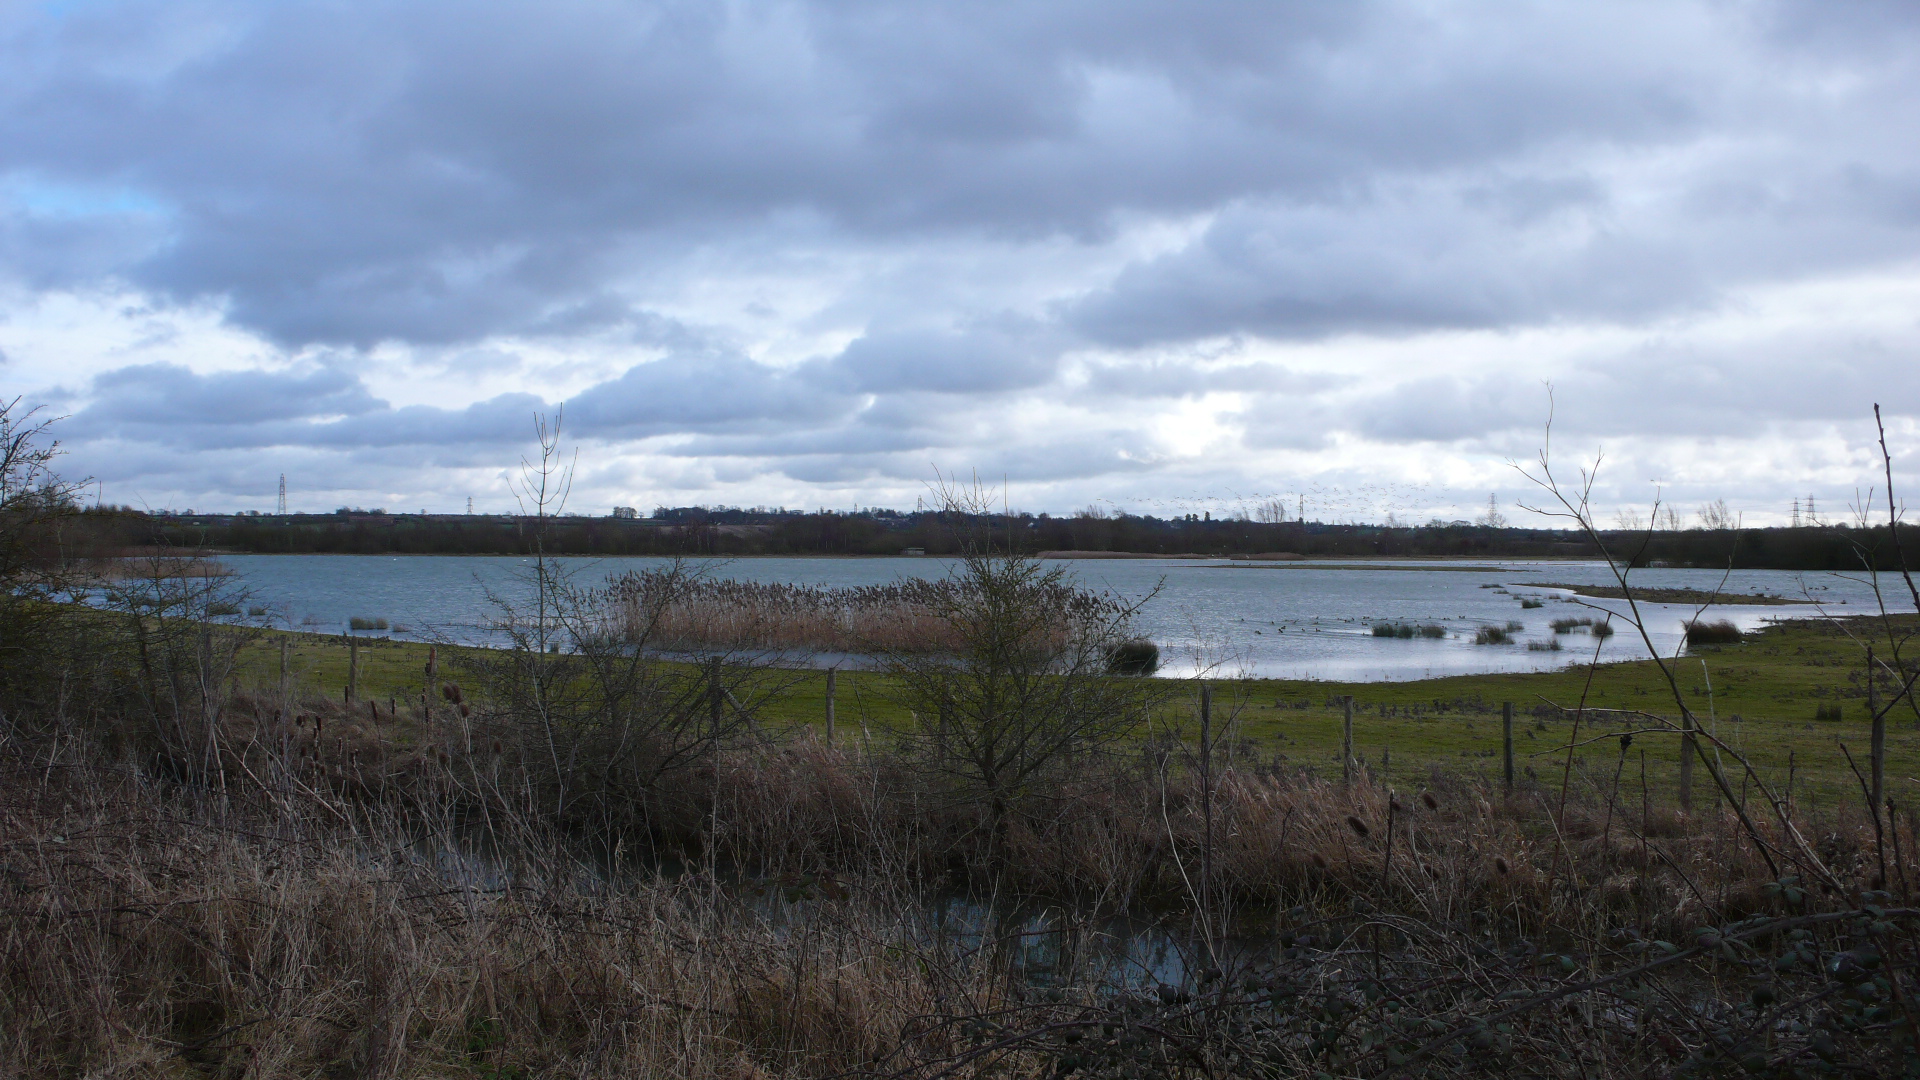
This is the text from a national press release that’s been sent out today by the Nene Valley Nature Improvement Area:

Wildlife, communities and local economies are reaping the benefits of England’s new Nature Improvement Areas, according to a report published last week (14th November).  The Nene Valley is one of these twelve Nature Improvement Areas (NIAs) set up by the government in 2012, which have helped farmers to access EU grants, made valuable contributions towards university research and boosted the £210 billion rural economy.

They’ve also attracted outside investment – more than £730,000 from business partners and £7.8 million from NGOs and not-for-profit organisations.  Environment Secretary Elizabeth Truss said:

“A healthy environment and a healthy economy go hand in hand. These Nature Improvement Areas show how protecting our precious wildlife and outstanding landscapes can help grow our £30 billion rural tourism industry and create more jobs for hardworking people as part of our long term economic plan.”

Almost 19,000 hectares of threatened habitat – equivalent to 23,000 football pitches- have been created or restored since the NIAs were set up with £7.5 million of government funding.  Volunteers have spent 24,300 days – or 66 years in total – surveying wildlife and improving habitats, and more than 11,000 people have taken part in educational visits.

These wild habitats are now bigger, better connected, and more widespread, enabling wildlife such as butterflies and water voles to thrive.

The Nene Valley NIA covers an area of 41,000 hectares running through the heart of Northamptonshire and skirting Huntingdonshire to the eastern fringes of Peterborough. It includes the River Nene and its tributaries, gravel pits, reservoirs and much of the floodplain. Heather Procter, Nene Valley Project Manager said:

“In the Nene Valley we must find a careful balance between the pressures for development, tourism and recreation and the valuable wildlife that the valley is increasingly known for.  Through the NIA we have so far ensured that 1,500ha of farmland is managed in a more environmentally-friendly way, created over 100ha of wildflower meadow, and engaged communities in the future of their local environment. As we work towards the end of this round of Government support for NIAs in March 2015, we urge the Minister to build on the good work already achieved through NIAs, and provide leadership and support for existing and new NIA projects into the future.”

NIAs were first announced in the Natural Environment White Paper, the first government White Paper on the environment for 20 years, with the aim of creating 12 initial areas to reconnect nature on a significant scale through local partnerships.

The NIA partnerships have improved access to the countryside, creating new public footpaths and connecting a network of paths which will span 540km by 2015.

The NIA partnerships are on track to restore, create, enhance and maintain a further 5,500 hectares by 2015, joining up people and communities with their landscapes.

But the vision doesn’t end there. In the Nene Valley there are plans to continue to protect and enhance the landscape for the benefit of wildlife, people and the economy for years to come. Local people can help us to form our plans for 2015-20 by adding their thoughts to the interactive map on the Nene Valley NIA website http://www.nenevalleynia.org/my-nene-valley.

ENDS

Notes for Editors

The report is: Monitoring and Evaluation of Nature Improvement Areas Year 2 (2013-14) Progress Report (Defra Research Project WC1061) and can be downloaded from WC1061.

The 12 Nature Improvement Areas (NIAs) are:

Birmingham and Black Country
Dearne Valley
Humberhead Levels
Marlborough Downs
Meres and Mosses of the Marches
Morecambe Bay Limestone and Wetlands
Nene Valley
Northern Devon
South Downs Way Ahead
The Dark Peak

The Greater Thames Marshes
Wild Purbeck

  1. The Nature Improvement Areas (NIAs) Programme, with funding of £7.5 million, was established, as announced by Defra in the Natural Environment White Paper (2011). This project has been supported by Defra, DCLG, Environment Agency, Forestry Commission and Natural England.
  1. Defra launched a competition to fund an initial 12 NIAs in July 2011, judged by a panel led by Professor Sir John Lawton. Seventy-six applications were received. The Nene Valley is one of the 12 successful partnerships that started work in April 2012.
  1. NIAs are large, discrete areas that will deliver a step change in nature conservation, where a local partnership has a shared vision for their natural environment. The partnership will plan and deliver significant improvements for wildlife and people through the sustainable use of natural resources, restoring and creating wildlife habitats, connecting local sites and joining up local action. http://www.naturalengland.org.uk
  1. It is not the intention for NIAs to stifle sustainable development. It is a matter for local authorities to decide what weight they wish to give to NIAs in their local plans.
  1. The Nene Valley NIA is a partnership project of more than 20 organisations in Northamptonshire, Huntingdonshire and Peterborough and covers over 41,000 hectares including countryside, urban fringe and town centres:  www.nenevalleynia.org

Media Contact

For more information, interview requests and photographs of the Nene Valley and its wildlife please contact Heather Procter, Nene Valley Project Manager, heather.procter@wildlifebcn.org or 01604 774032.