
 It is a general ecological rule that no species exists in isolation; all species interact with other organisms within the communities to which they belong. The collection and analysis of ecological interaction data has burgeoned over the past couple of decades, particularly in my own area of (largely) mutualistic species interactions such as plant-pollinator relationships – see for example this recent post on hummingbird-plant networks.
There are a number of software packages available for analysing and visualising this type of data, including bipartite and foodweb in R, Food Web Designer, and Gephi. Tools such as this vary in their flexibility and in the investment of time required to produce good quality graphics, and ultimately it’s down to personal preferences which you use.
Recently I discovered some very user-friendly network visualisation software that is browser/cloud based, free to use (at least the basic version), very flexible, intuitive and quick to learn. Ideal if you are pressed for time and want to generate some quick food webs.
The system is called Polinode and was developed primarily to visualise business and social science data (the “poli” part is nothing to do with pollination, that’s purely coincidental). However there’s no reason why it can’t be used for ecological data, as the image above demonstrates. This is a visualisation of mixed-species flocks of birds feeding together and alone on a local urban park that I’ve discussed previously. The thickness of the line is proportional to number of interactions observed, and the size of each node is proportional to the number of birds. Both are scalable in Polinode.
One could also present these data as a straight-line graph, without the loops to indicate single-species feeding:

As well as these types of networks it’s also possible to produce bipartite (what Polinode terms “hierarchical”) graphs, for example this network of bumblebees feeding on different plant families in a British grassland (click for a closer view – I realised afterwards that I downloaded a rather small version):
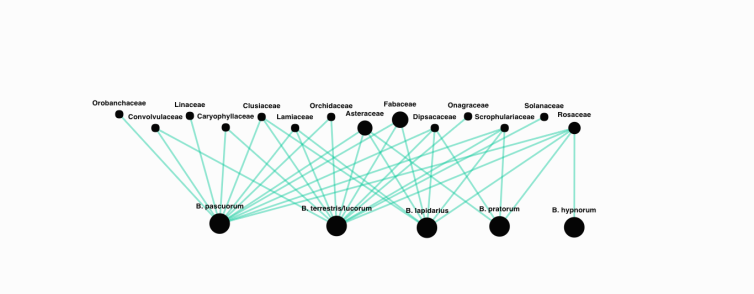
The system is very flexible and nodes can be grabbed and moved around (as I did above to offset the plant family nodes), recoloured, resized, text resized, etc.
Polinode also calculates a range of network metrics such as degree and Louvain communities (a measure of modularity) which is more limited than some ecologists might require, but which is a good starting point for those new to ecological network statistics.
Data files can be uploaded directly from Excel, and there are example templates showing how to lay out the data. There is also ample online support including written guidance, videos, and a regular blog. Even in the few months I’ve been playing with the system the developers have added more features, including a graphing facility that generates column and scatter plots from your networks.
There you go, that’s an introduction to Polinode for ecologists; hope it’s useful for your work.

Great tip, Jeff! The software seems very useful for classes purpose. Thank you! 🙂
Hi Jeff,
Andrew Pitts here, founder of Polinode. Terrific post! You are quite right that Polinode was originally designed for oganisational network analysis but we’ve been pleasantly surprised by the diverse alternative use cases that users have found for it. Applications in biology have been quite popular. Of course, we are keen to support the use of Polinode in academia and for educational purposes and have an Academic account designed specifically for that.
I’ll reach out to you offline to learn a bit more about some of the extra metrics you would like to see added but just wanted quickly say how much I enjoyed your post.
Andrew
Thanks a lot Andrew, happy to offer some advice if it’s useful. Best wishes, Jeff
Thanks for this post Jeff. This looks very promising for teaching networks to my undergraduate biodiversity students. I’m looking forward to trialling this soon.